C/2004 T3 Siding Spring
more info
C/2004 T3 was discovered by Robert H. McNaught on images from the Siding Spring 0.5m Uppsala Schmidt on 12 October 2004. Next days, its cometary apperance was confirmed by observers [IAUC 8421, 2004 October 21]. At the moment of discovery, it was 1.5 yr after its perihelion passage (see figure).
This comet made its closest approach to the Earth on 19 July 2003 (8.611 au), three months after perihelion.
Solution given here is based on data spanning over 1.3 yr in a range of heliocentric distances from 9.40 au to 10.6 au.
This Oort spike comet suffers slight planetary perturbations during its passage through the planetary system.
See also Królikowska 2014 and Królikowska and Dybczyński 2017.
| solution description | ||
|---|---|---|
| number of observations | 109 | |
| data interval | 2004 10 12 – 2006 01 31 | |
| data type | observed only after perihelion (POST) | |
| data arc selection | entire data set (STD) | |
| range of heliocentric distances | 9.4 au – 10.6au | |
| detectability of NG effects in the comet's motion | NG effects not determinable | |
| type of model of motion | GR - gravitational orbit | |
| data weighting | YES | |
| number of residuals | 209 | |
| RMS [arcseconds] | 0.44 | |
| orbit quality class | 1a | |
| previous orbit statistics, both Galactic and stellar perturbations were taken into account | ||
|---|---|---|
| no. of returning VCs in the swarm | 5001 | * |
| no. of escaping VCs in the swarm | 0 | |
| no. of hyperbolas among escaping VCs in the swarm | 0 | |
| previous reciprocal semi-major axis [10-6 au-1] | 40.65 – 48.13 – 56.00 | |
| previous perihelion distance [au] | 22 – 140 – 240 | |
| previous aphelion distance [103 au] | 36 – 41 – 49 | |
| time interval to previous perihelion [Myr] | 2.7 – 3.3 – 4 | |
| percentage of VCs with qprev < 10 | 5 | |
| percentage of VCs with 10 < qprev < 20 | 5 | |
| percentage of VCs with qprev > 20 | 90 | |
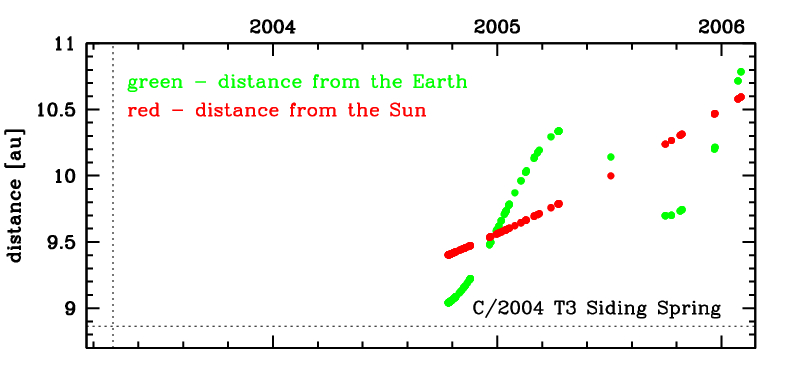
Time distribution of positional observations with corresponding heliocentric (red curve) and geocentric (green curve) distance at which they were taken. The horizontal dotted line shows the perihelion distance for a given comet whereas vertical dotted line — the moment of perihelion passage.
| previous_g orbit statistics, here only the Galactic tide has been included | ||
|---|---|---|
| no. of returning VCs in the swarm | 5001 | * |
| no. of escaping VCs in the swarm | 0 | |
| no. of hyperbolas among escaping VCs in the swarm | 0 | |
| previous reciprocal semi-major axis [10-6 au-1] | 40.18 – 45.64 – 51.07 | |
| previous perihelion distance [au] | 14 – 16 – 21 | |
| previous aphelion distance [103 au] | 39 – 44 – 50 | |
| time interval to previous perihelion [Myr] | 2.7 – 3.2 – 3.9 | |
| percentage of VCs with 10 < qprev < 20 | 86 | |
| percentage of VCs with qprev > 20 | 14 | |