C/2005 B1 Christensen
more info
C/2005 B1 was discovered by Eric Christensen on 16 January 2005 on Catalina Sky Survey images and its cometary apperance was soon confirmed [IAUC 8466, 2005 January 17]. Next, 2004 FS101 reported as asteroidal object by LINEAR and Spacewatch in March 2004 was identified with C/2005 B1 [IAUC 8469, 2005 January 19].
This comet made its closest approach to the Earth on 30 September 2006 (3.003 au), seven months after perihelion passage (see figure).
Solutions given here are based on data spanning over 3.6 yr in a range of heliocentric distances: 6.94 au – 3.205 au (perihelion) – 5.49 au.
This Oort spike comet suffers small planetary perturbations during its passage through the planetary system that lead to a more tight future orbit (see future barycentric orbit).
See also Królikowska 2014 and Królikowska and Dybczyński 2017.
| solution description | ||
|---|---|---|
| number of observations | 1517 | |
| data interval | 2004 03 18 – 2007 11 03 | |
| data type | perihelion within the observation arc (FULL) | |
| data arc selection | entire data set (STD) | |
| range of heliocentric distances | 6.94 au – 3.21 au (perihelion) – 5.49 au | |
| type of model of motion | NS - non-gravitational orbits for standard g(r) | |
| data weighting | YES | |
| number of residuals | 2985 | |
| RMS [arcseconds] | 0.43 | |
| orbit quality class | 1a+ | |
| orbital elements (barycentric ecliptic J2000) | ||
|---|---|---|
| Epoch | 1704 01 09 | |
| perihelion date | 2006 02 22.26207000 | ± 0.00022700 |
| perihelion distance [au] | 3.20593580 | ± 0.00000162 |
| eccentricity | 0.99998720 | ± 0.00000195 |
| argument of perihelion [°] | 103.106005 | ± 0.000054 |
| ascending node [°] | 195.570413 | ± 0.000012 |
| inclination [°] | 92.497575 | ± 0.000012 |
| reciprocal semi-major axis [10-6 au-1] | 3.99 | ± 0.61 |
| file containing 5001 VCs swarm |
|---|
| 2005b1n2.bmi |
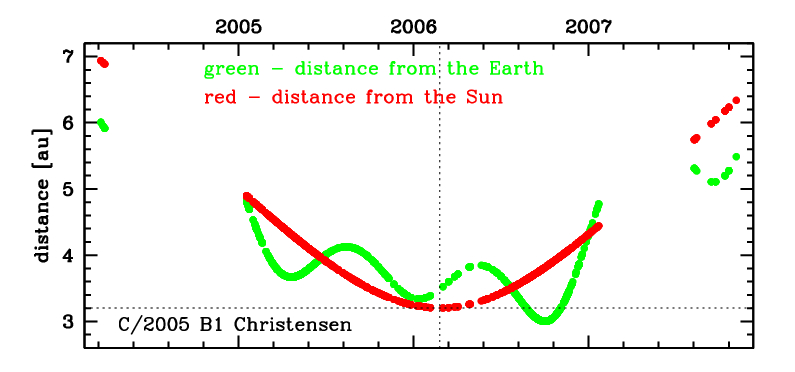
Time distribution of positional observations with corresponding heliocentric (red curve) and geocentric (green curve) distance at which they were taken. The horizontal dotted line shows the perihelion distance for a given comet whereas vertical dotted line — the moment of perihelion passage.
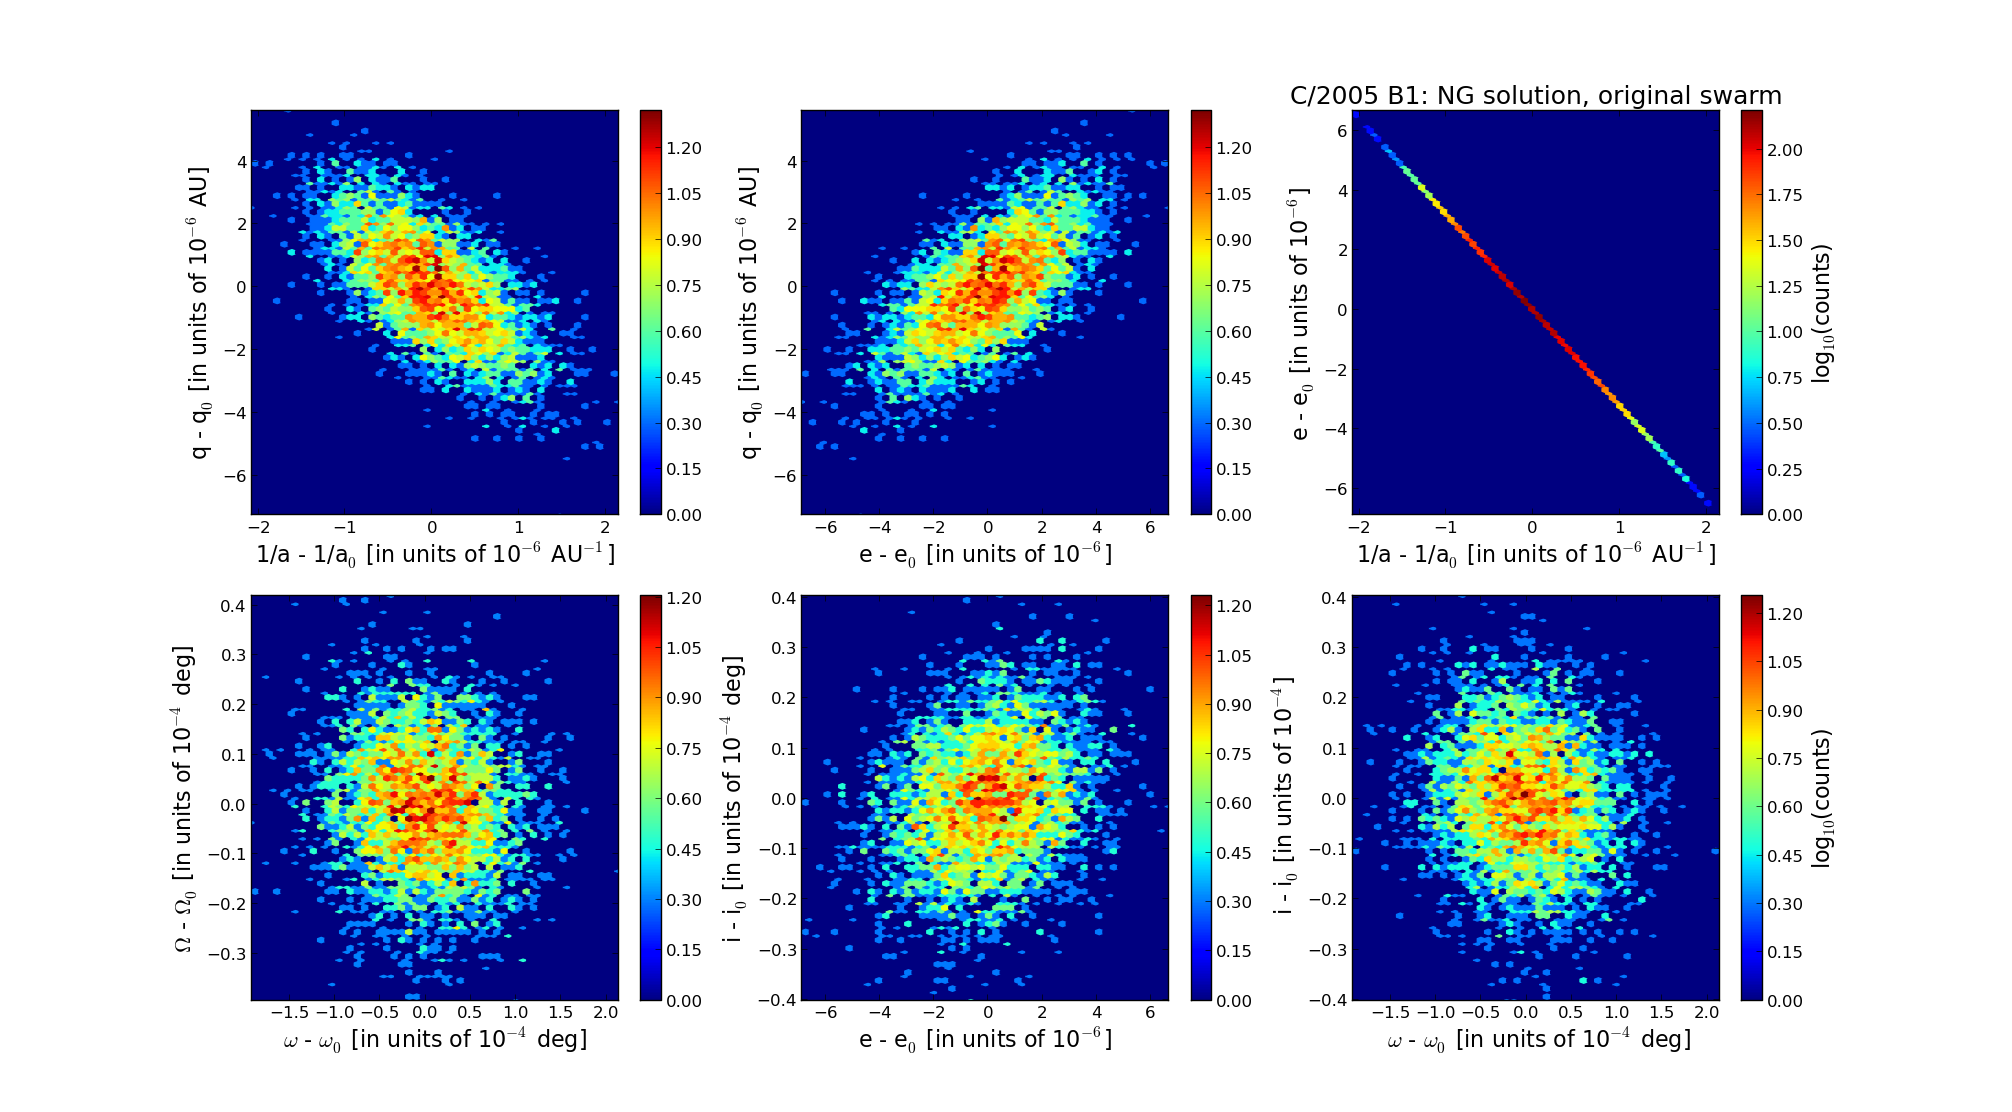
Six 2D-projections of the 6D space of original swarm including 5001 VCs. Each density map is given in logarithmic scale presented on the right in the individual panel.