C/2005 EL173 LONEOS
more info
C/2005 EL173 was discovered on 8 March 2005 by the LONEOS as an apparently asteroidal object in a retrograde orbit and semimajor axis of 36 au [MPEC 2005-F48, 2005 March 29]. Therefore it was initially classified as cubewano or scattered disc object in MPC. Its cometary apperance was reported by A. Fitzsimmons on 10 May 2005. C/2005 EL173 was observed until mid-November 2008.
This comet made its closest approach to the Earth on 4 January 2007 (3.310 au), two months before perihelion passage.
Solutions given here are based on data spanning over 3.7 yr in a range of heliocentric distances: 7.12 au – 3.886 au (perihelion) – 6.45 au.
NG orbit using full data-arc is determinable.
This Oort spike comet suffers rather slight planetary perturbations during its passage through the planetary system; however, these perturbations leas to escape this comet from the planetary zone on a hyperbolic orbit.
See also Królikowska and Dones 2023, Królikowska and Dybczyński 2017,and Królikowska 2014.
| solution description | ||
|---|---|---|
| number of observations | 231 | |
| data interval | 2005 03 03 – 2007 03 01 | |
| data arc selection | data generally limited to pre-perihelion (PRE) | |
| range of heliocentric distances | 7.12 au – 3.89au | |
| detectability of NG effects in the comet's motion | comet with determinable NG~orbit | |
| type of model of motion | GR - gravitational orbit | |
| data weighting | YES | |
| number of residuals | 457 | |
| RMS [arcseconds] | 0.43 | |
| orbit quality class | 1a | |
| previous orbit statistics, both Galactic and stellar perturbations were taken into account | ||
|---|---|---|
| no. of returning VCs in the swarm | 5002 | * |
| no. of escaping VCs in the swarm | 0 | |
| no. of hyperbolas among escaping VCs in the swarm | 0 | |
| previous reciprocal semi-major axis [10-6 au-1] | 50.36 – 52.84 – 55.61 | |
| previous perihelion distance [au] | 61 – 100 – 150 | |
| previous aphelion distance [103 au] | 35.9 – 37.7 – 39.6 | |
| time interval to previous perihelion [Myr] | 2.79 – 2.94 – 3.11 | |
| percentage of VCs with qprev > 20 | 100 | |
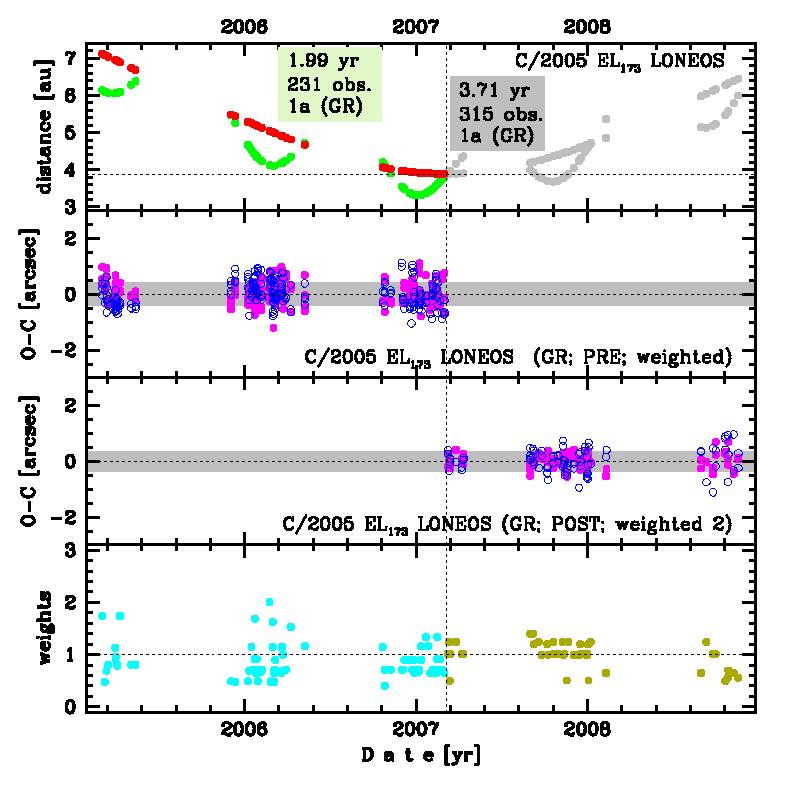
Upper panel: Time distribution of positional observations with corresponding heliocentric (red curve) and geocentric (green curve) distance at which they were taken. The horizontal dotted line shows the perihelion distance for a given comet whereas vertical dotted line — the moment of perihelion passage.
Middle panel(s): O-C diagram for a given solution (sometimes in comparison to another solution available in CODE), where residuals in right ascension are shown using magenta dots and in declination by blue open circles.
Lowest panel: Relative weights for a given data set(s).
Middle panel(s): O-C diagram for a given solution (sometimes in comparison to another solution available in CODE), where residuals in right ascension are shown using magenta dots and in declination by blue open circles.
Lowest panel: Relative weights for a given data set(s).
| previous_g orbit statistics, here only the Galactic tide has been included | ||
|---|---|---|
| no. of returning VCs in the swarm | 5002 | * |
| no. of escaping VCs in the swarm | 0 | |
| no. of hyperbolas among escaping VCs in the swarm | 0 | |
| previous reciprocal semi-major axis [10-6 au-1] | 47.22 – 48.86 – 50.54 | |
| previous perihelion distance [au] | 6.68 – 7.1 – 7.59 | |
| previous aphelion distance [103 au] | 39.6 – 40.9 – 42.3 | |
| time interval to previous perihelion [Myr] | 2.78 – 2.92 – 3.07 | |
| percentage of VCs with qprev < 10 | 100 | |