C/2005 L3 McNaught
more info
C/2005 L3 was discovered by R.H. McNaught with the 0.5-m Uppsala Schmidt in the course of the Siding Spring Survey on 3 June 2005 [IAUC 8536, 2005 June 7]. Later, prediscovery detections by Siding Spring Survey were found (16 July and 16 August 2004, see figure).
This comet made two closest approaches to the Earth on 24 June 2007 (4.852 au, almost seven months before perihelion) and 12 May 2008 (4.857 au, four months after perihelion).
Solutions given here are based on data spanning over 9.48 yr (10 oppositions) in a range of heliocentric distances: 10.3 au – 5.593 au (perihelion) – 14.9 au.
NG orbit using full data-arc is determinable.
This Oort spike comet suffers rather small planetary perturbations during its passage through the planetary system that lead to a more tight future orbit (see future barycentric orbit).
See also Królikowska and Dones 2023, Królikowska and Dybczyński 2017,and Królikowska 2014.
| solution description | ||
|---|---|---|
| number of observations | 5339 | |
| data interval | 2004 07 16 – 2014 01 09 | |
| data type | perihelion within the observation arc (FULL) | |
| data arc selection | entire data set (STD) | |
| range of heliocentric distances | 10.3 au – 5.59 au (perihelion) – 14.93 au | |
| type of model of motion | NC - non-gravitational orbits for symmetric CO-g(r)-like function | |
| data weighting | YES | |
| number of residuals | 10453 | |
| RMS [arcseconds] | 0.49 | |
| orbit quality class | 1a+ | |
| orbital elements (barycentric ecliptic J2000) | ||
|---|---|---|
| Epoch | 2317 09 16 | |
| perihelion date | 2008 01 14.82163407 | ± 0.00069308 |
| perihelion distance [au] | 5.58868985 | ± 0.00000390 |
| eccentricity | 0.99836429 | ± 0.00000268 |
| argument of perihelion [°] | 47.062861 | ± 0.000064 |
| ascending node [°] | 288.804433 | ± 0.000014 |
| inclination [°] | 139.445856 | ± 0.000003 |
| reciprocal semi-major axis [10-6 au-1] | 292.68 | ± 0.48 |
| file containing 5001 VCs swarm |
|---|
| 2005l3bc.bpl |
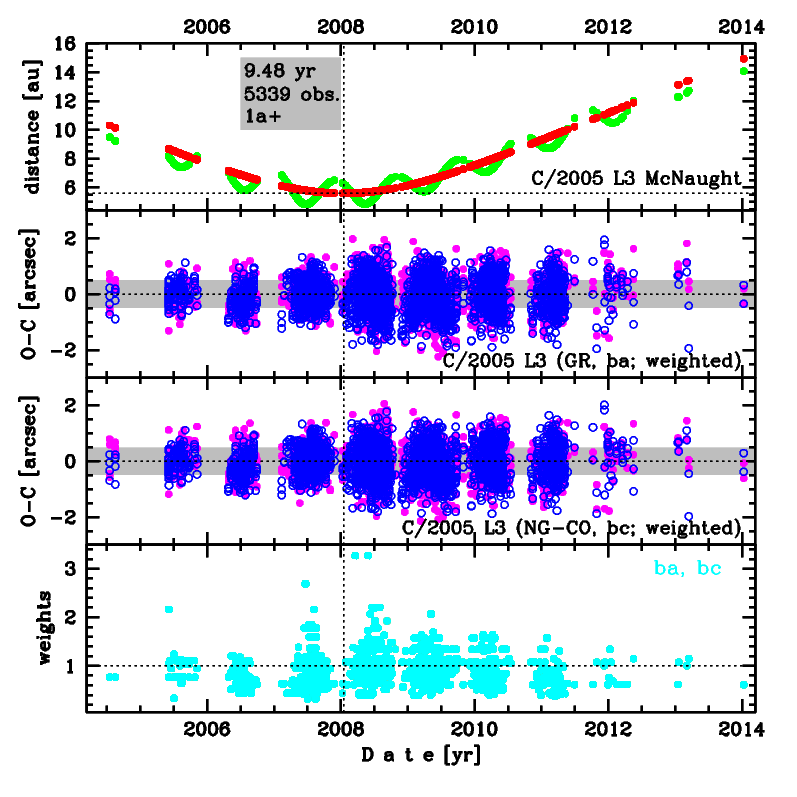
Upper panel: Time distribution of positional observations with corresponding heliocentric (red curve) and geocentric (green curve) distance at which they were taken. The horizontal dotted line shows the perihelion distance for a given comet whereas vertical dotted line — the moment of perihelion passage.
Middle panel(s): O-C diagram for a given solution (sometimes in comparison to another solution available in CODE), where residuals in right ascension are shown using magenta dots and in declination by blue open circles.
Lowest panel: Relative weights for a given data set(s).
Middle panel(s): O-C diagram for a given solution (sometimes in comparison to another solution available in CODE), where residuals in right ascension are shown using magenta dots and in declination by blue open circles.
Lowest panel: Relative weights for a given data set(s).
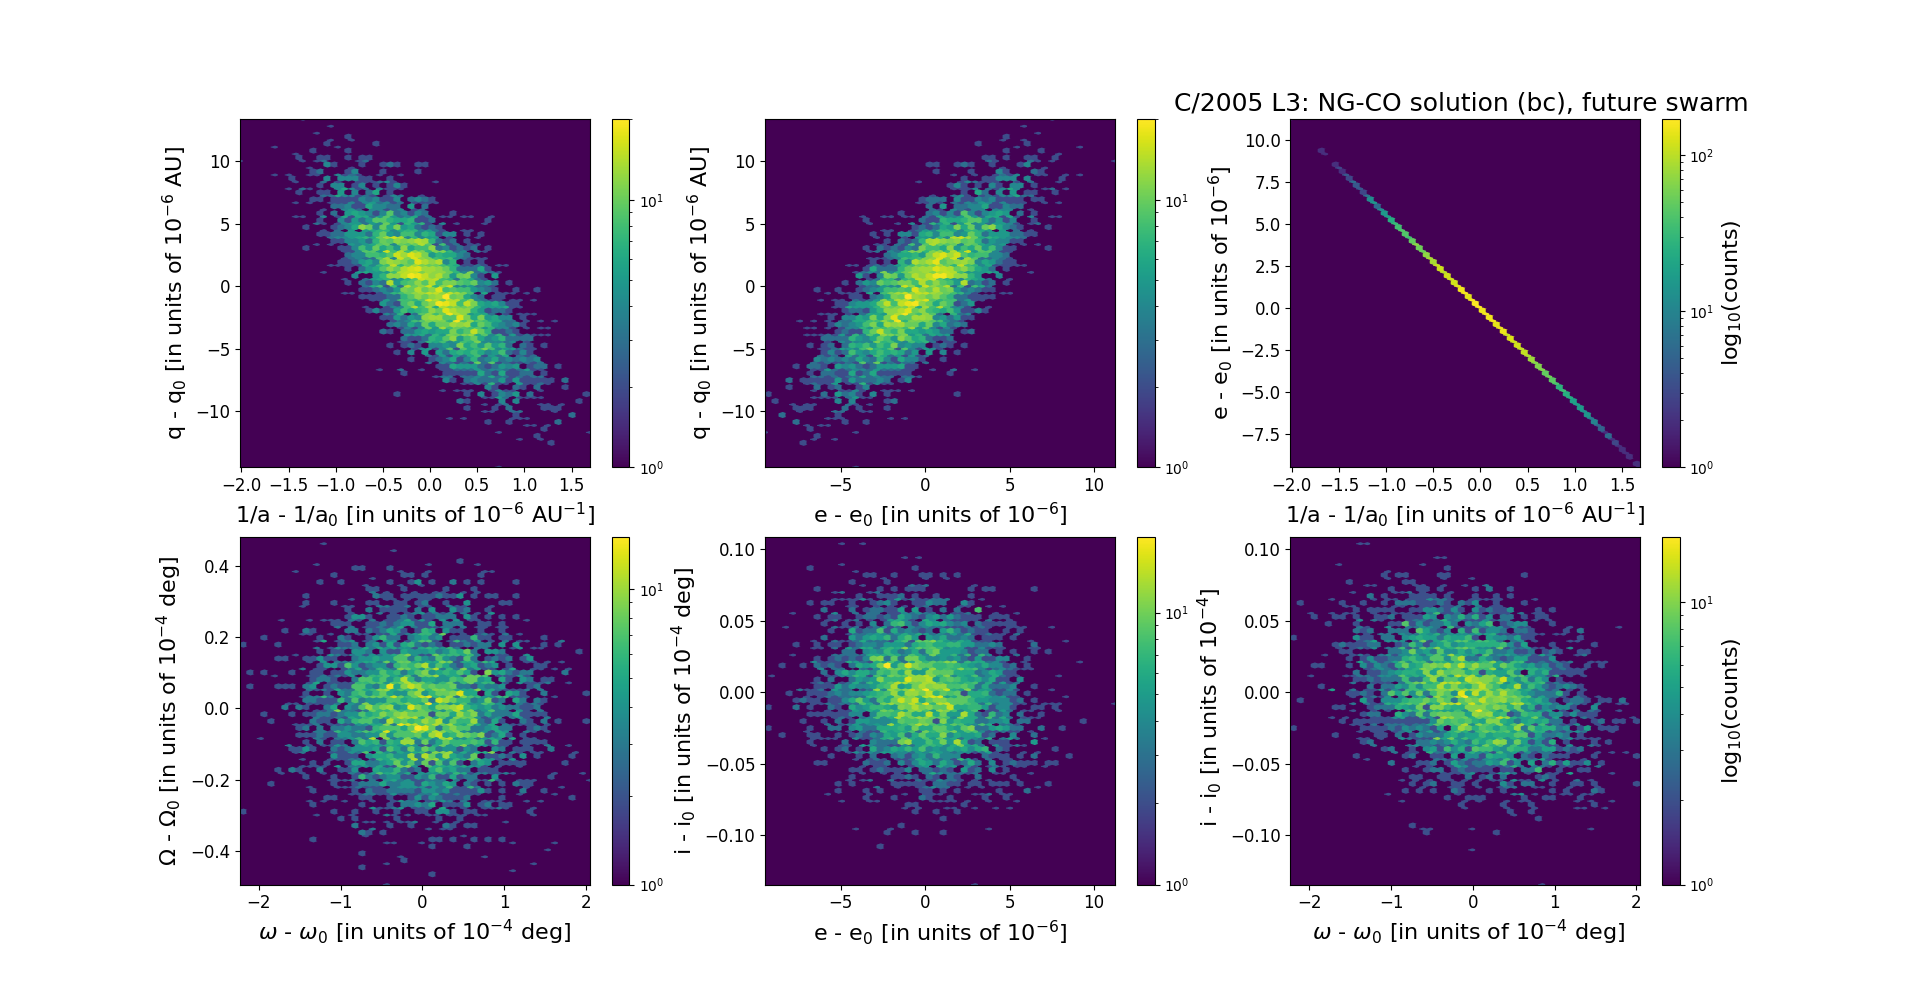
Six 2D-projections of the 6D space of future swarm including 5001 VCs. Each density map is given in logarithmic scale presented on the right in the individual panel.