C/2006 HW51 Siding Spring
more info
Comet C/2006 HW51 was discovered on 23 April 2006 with Siding Spring; that is about 5 months before its perihelion passage. It was observed until 7 August 2007 (see picture).
Comet had its closest approach to the Earth on 3 May 2006 (2.280 au), 10 days after its discovery.
Here, two solutions based on entire data set (a6 and n5) are very similar quality, and in Królikowska and Dybczyński 2013 we recomended pure GR solution for past and future orbital evolution. Both these solutions are based on data spanning over 1.29 yr in a range of heliocentric distances: 2.87 au – 2.259 au (perihelion) – 4.04 au. Here, we chose the NG solution as preferred;see Królikowska 2020.
This Oort spike comet suffers tiny planetary perturbations during its passage through the planetary system (compare original and future barycentric orbits for preferred orbit).
| solution description | ||
|---|---|---|
| number of observations | 187 | |
| data interval | 2006 04 23 – 2007 08 07 | |
| data type | perihelion within the observation arc (FULL) | |
| data arc selection | entire data set (STD) | |
| range of heliocentric distances | 2.87 au – 2.27 au (perihelion) – 4.04 au | |
| type of model of motion | NS - non-gravitational orbits for standard g(r) | |
| data weighting | YES | |
| number of residuals | 359 | |
| RMS [arcseconds] | 0.28 | |
| orbit quality class | 1a | |
| orbital elements (barycentric ecliptic J2000) | ||
|---|---|---|
| Epoch | 1705 12 29 | |
| perihelion date | 2006 09 29.57078389 | ± 0.00043025 |
| perihelion distance [au] | 2.25938466 | ± 0.00000445 |
| eccentricity | 0.99993149 | ± 0.00000994 |
| argument of perihelion [°] | 0.103846 | ± 0.000175 |
| ascending node [°] | 228.162916 | ± 0.000050 |
| inclination [°] | 45.85697 | ± 0.000029 |
| reciprocal semi-major axis [10-6 au-1] | 30.32 | ± 4.40 |
| file containing 5001 VCs swarm |
|---|
| 2006hwn5.bmi |
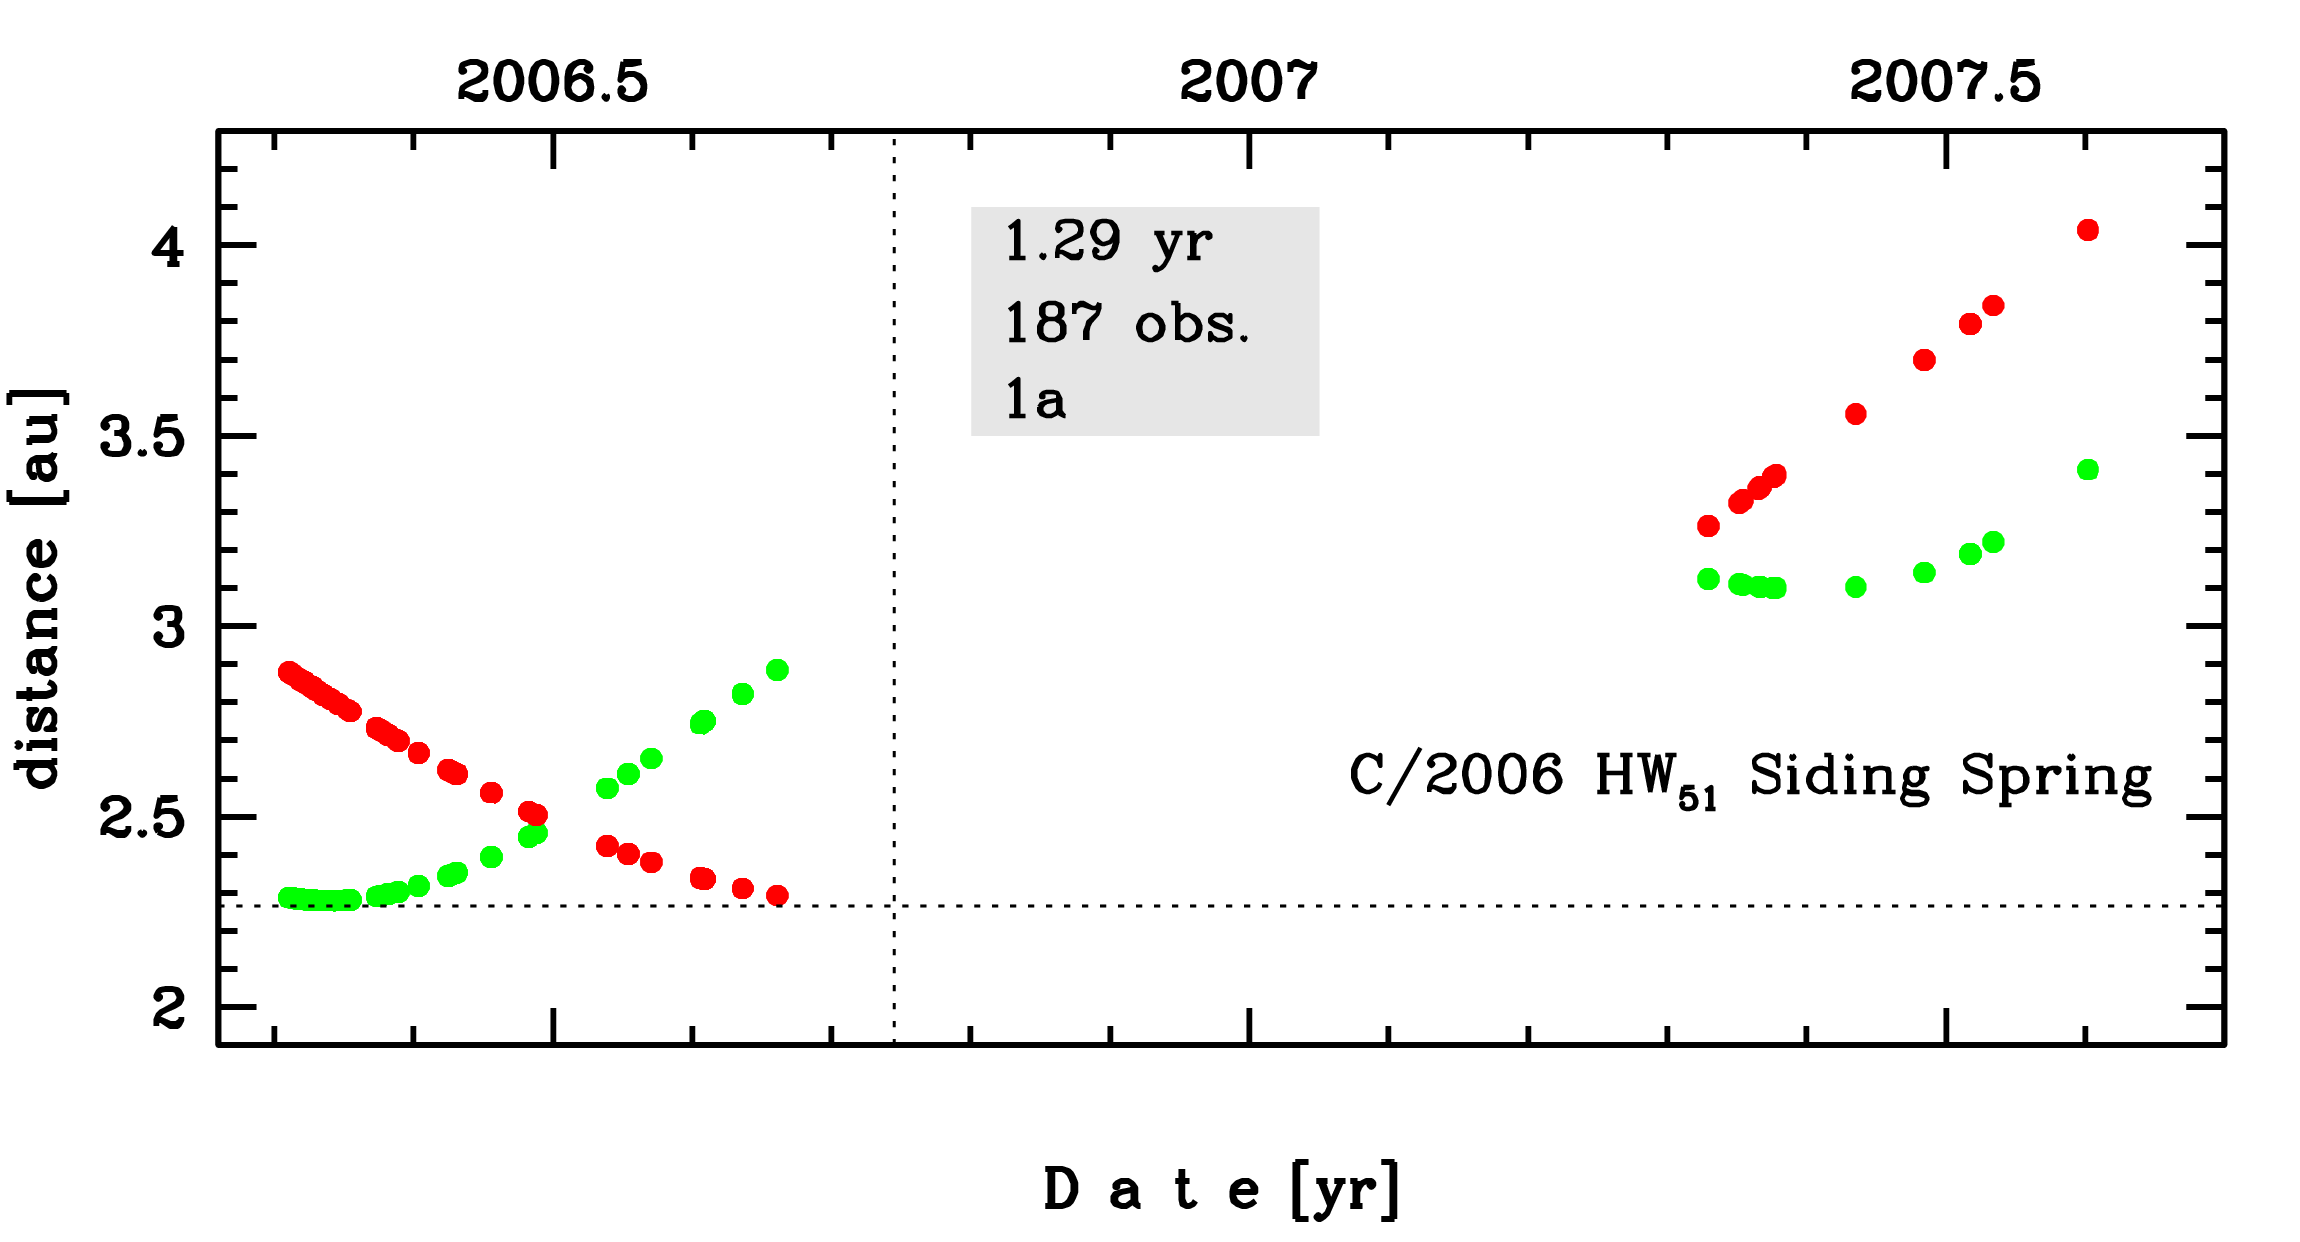
Time distribution of positional observations with corresponding heliocentric (red curve) and geocentric (green curve) distance at which they were taken. The horizontal dotted line shows the perihelion distance for a given comet whereas vertical dotted line — the moment of perihelion passage.
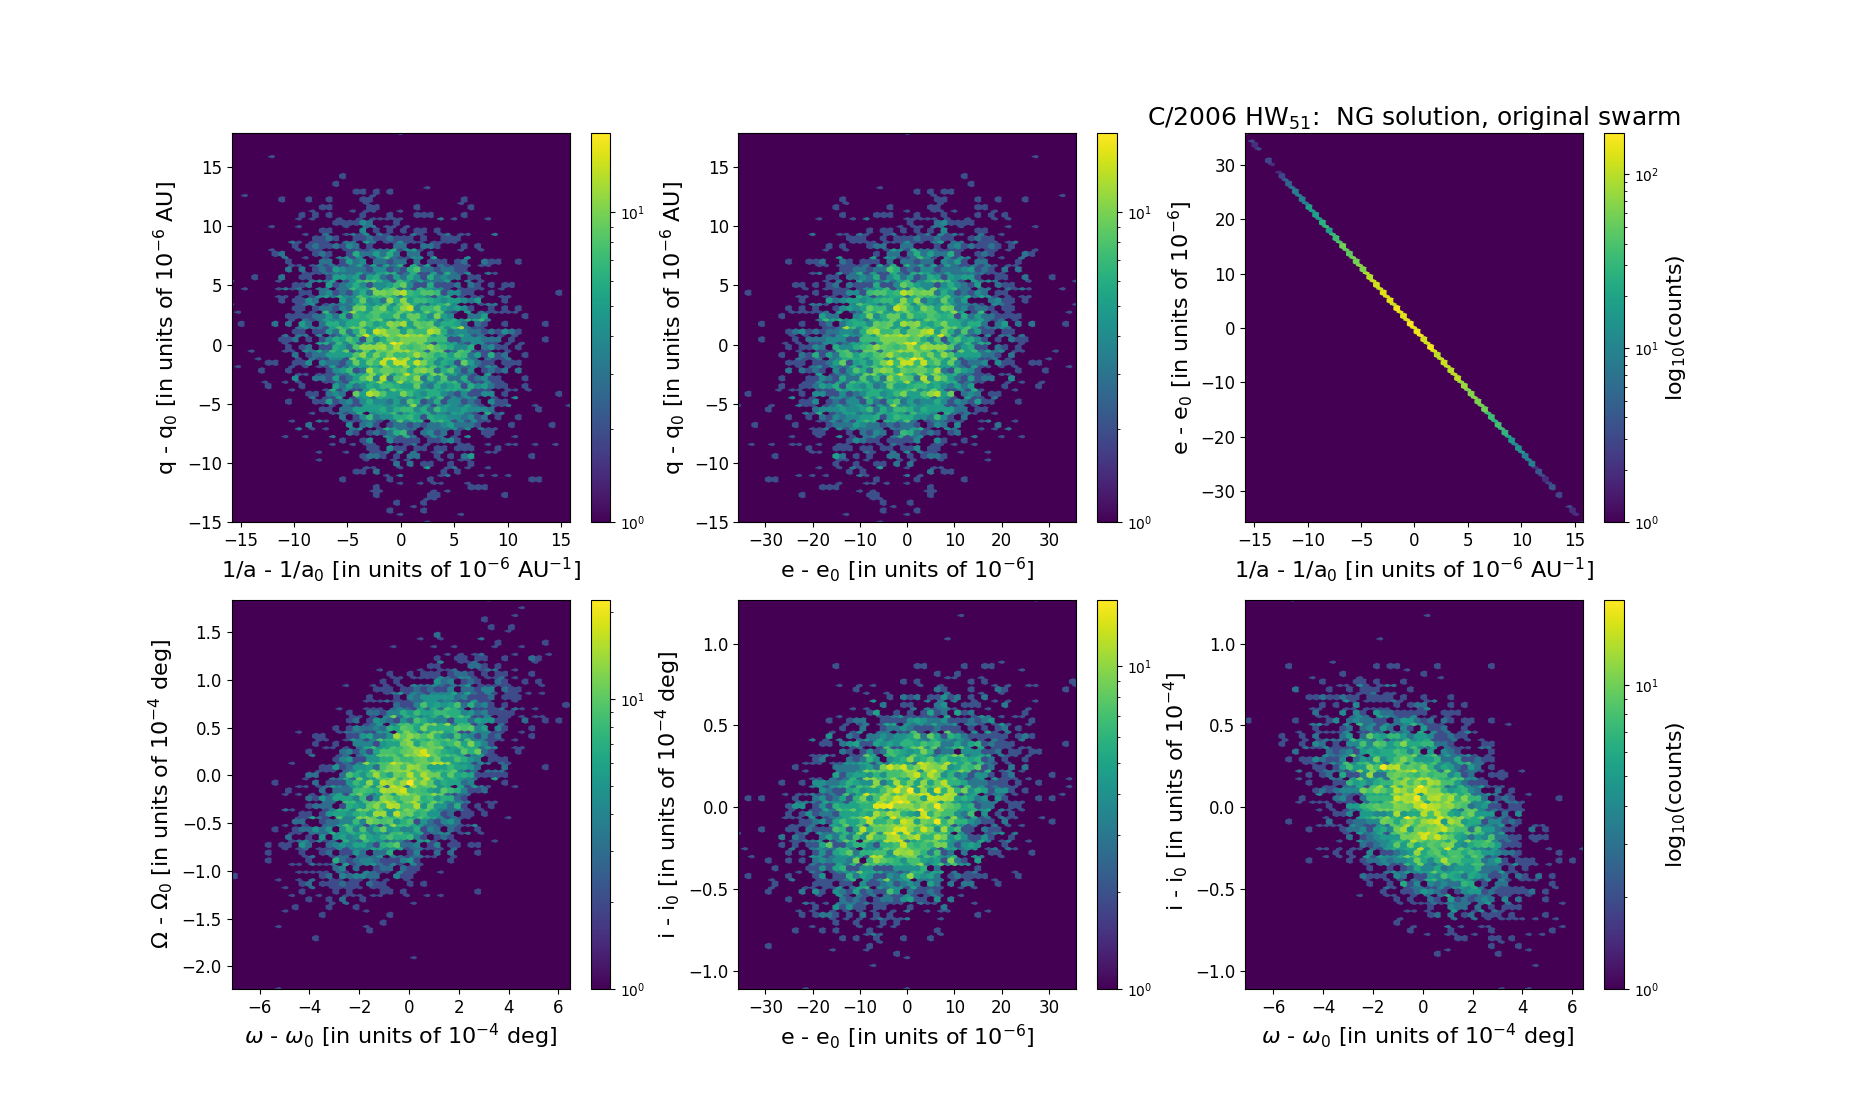
Six 2D-projections of the 6D space of original swarm including 5001 VCs. Each density map is given in logarithmic scale presented on the right in the individual panel.