C/2007 U1 LINEAR
more info
Comet C/2007 U1 was discovered on 19 October 2007 by LINEAR project, 9.5 months before its perihelion passage.
C/2007 U1 was observed 2.1 yr during three oppositions in a range of heliocentric distances: 4.28 au – 3.329 au (perihelion) – 5.36 au.
Comet had its closest approach to the Earth on 21 October 2008 (2.424 au, 2.5 months after perihelion).
This comet suffers small planetary perturbations during its passage through the planetary system that lead to a less tight orbit with semimajor axis larger than 10,000 au.
See also Królikowska and Dybczyński 2017.
| solution description | ||
|---|---|---|
| number of observations | 896 | |
| data interval | 2007 10 19 – 2009 11 18 | |
| data type | perihelion within the observation arc (FULL) | |
| data arc selection | entire data set (STD) | |
| range of heliocentric distances | 4.28 au – 3.33 au (perihelion) – 5.36 au | |
| type of model of motion | NS - non-gravitational orbits for standard g(r) | |
| data weighting | YES | |
| number of residuals | 1774 | |
| RMS [arcseconds] | 0.41 | |
| orbit quality class | 1a | |
| orbital elements (barycentric ecliptic J2000) | ||
|---|---|---|
| Epoch | 1704 06 17 | |
| perihelion date | 2008 08 07.83915282 | ± 0.00035433 |
| perihelion distance [au] | 3.33102874 | ± 0.00000234 |
| eccentricity | 0.99944731 | ± 0.00000390 |
| argument of perihelion [°] | 0.975217 | ± 0.000078 |
| ascending node [°] | 50.000626 | ± 0.000034 |
| inclination [°] | 157.779808 | ± 0.000015 |
| reciprocal semi-major axis [10-6 au-1] | 165.92 | ± 1.17 |
| file containing 5001 VCs swarm |
|---|
| 2007u1n2.bmi |
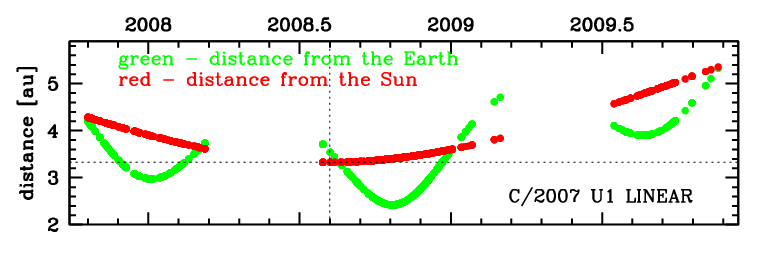
Time distribution of positional observations with corresponding heliocentric (red curve) and geocentric (green curve) distance at which they were taken. The horizontal dotted line shows the perihelion distance for a given comet whereas vertical dotted line — the moment of perihelion passage.
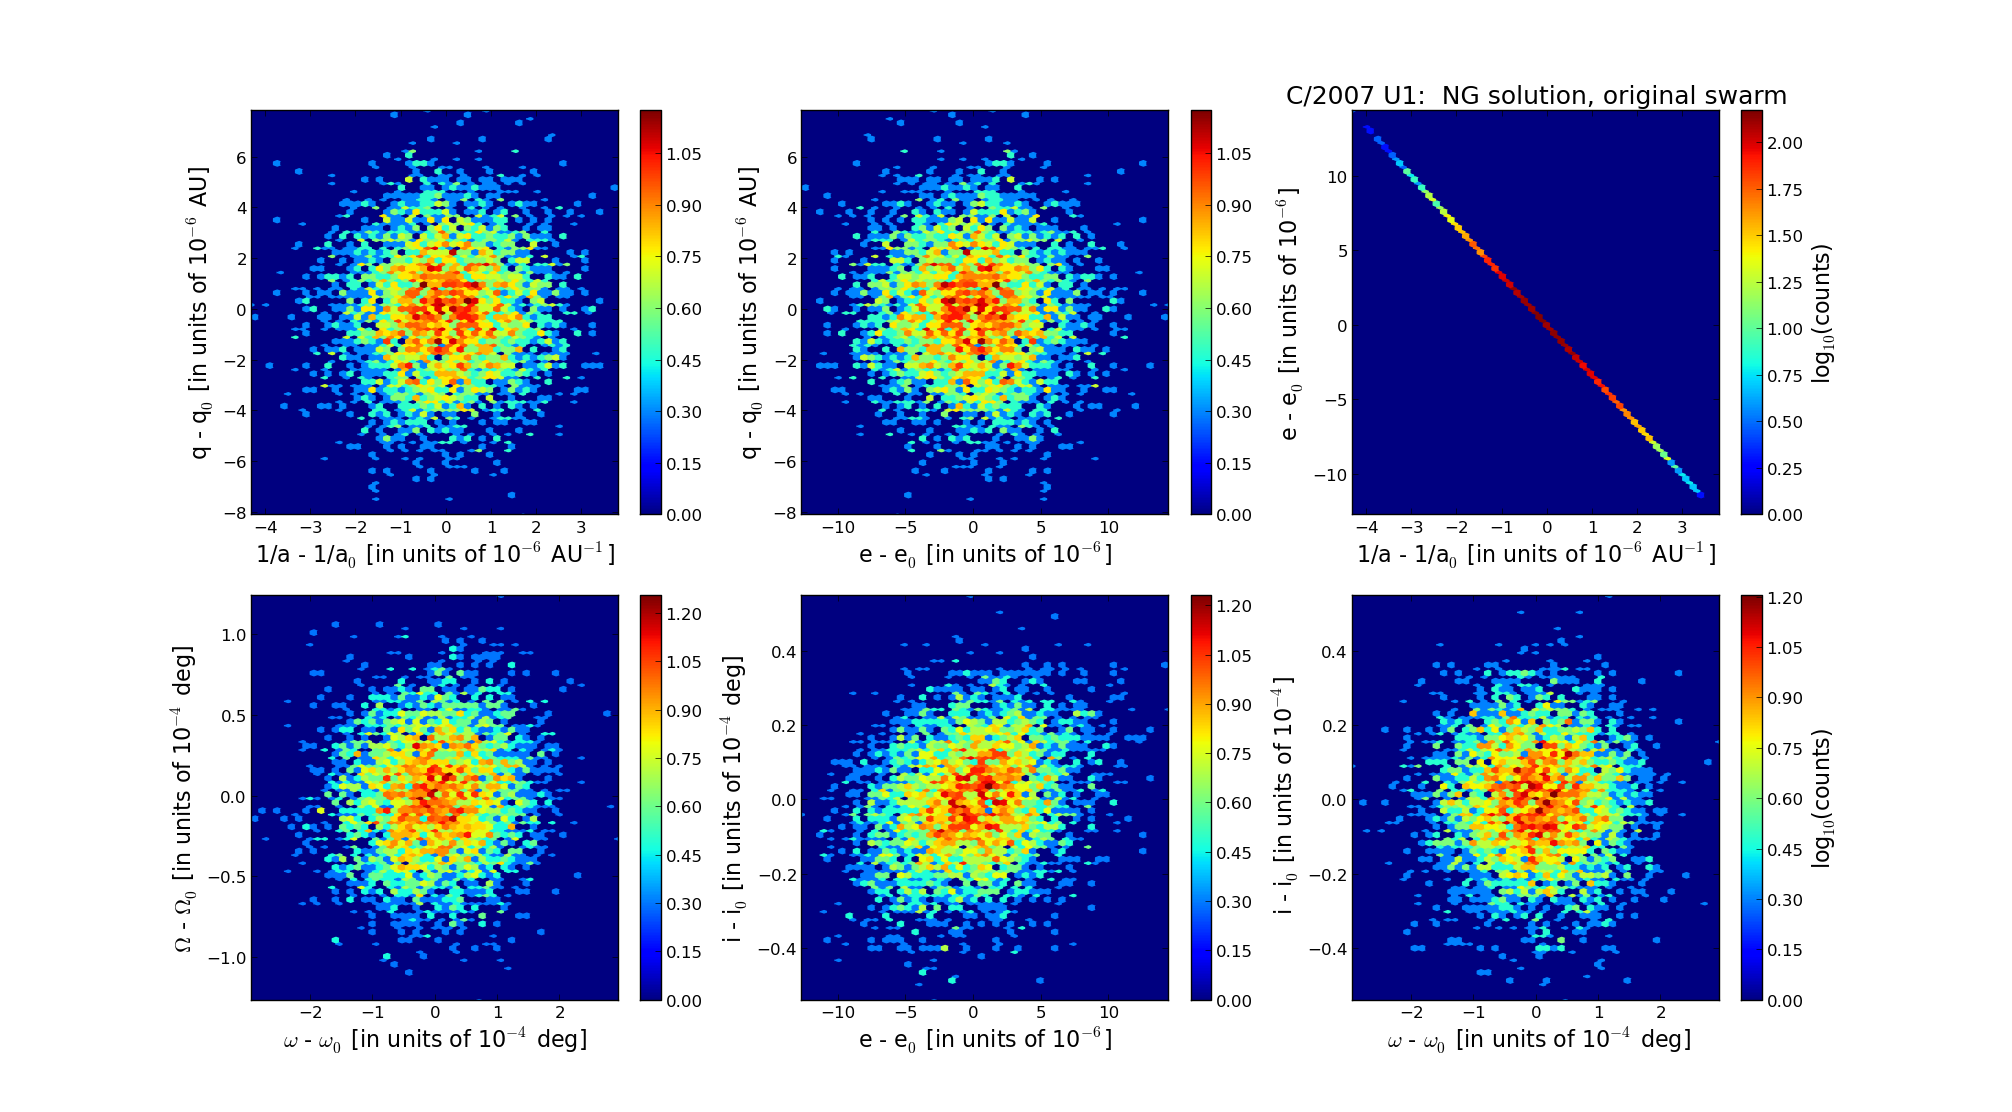
Six 2D-projections of the 6D space of original swarm including 5001 VCs. Each density map is given in logarithmic scale presented on the right in the individual panel.