C/2008 A1 McNaught
more info
Comet C/2008 A1 was discovered on 10 January 2008 by Robert H. McNaught (Siding Spring Observatory); that is about 8.5 months before its perihelion passage. It was observed until 17 January 2010.
Comet had its closest approach to the Earth on 4 September 2008 (1.325 au), about 3.5 weeks before its perihelion passage.
C/2008 A1 is a comet with non-gravitational effects strongly manifested in positional data fitting. Trends in the O-C time variations even for asymmetric non-gravitational solutions based on entire data set were noticed; however, the asymmetric non-gravitational solution is given here as the preferred global solution for this comet; and this solution is based on data spanning over 2.02 yr in a range of heliocentric distances: 3.73 au – 1.073 au (perihelion) – 5.82 au.
Due to its erratic behaviour, this comet (similarly as C/2007 W1) should be examined in a special way and two dedicated separate non-gravitational orbits (p5 and r5) were determined (recommended for backward and forward dynamical studies, respectively).
This comet with original semimajor axis of about 8,000 au suffers small planetary perturbations during its passage through the planetary system and these perturbations lead to a more tight future orbit (see future barycentric orbits).
See also Królikowska and Dybczyński 2013 and Królikowska 2020.
| solution description | ||
|---|---|---|
| number of observations | 552 | |
| data interval | 2008 10 01 – 2010 01 17 | |
| data arc selection | data generally limited to post-perihelion (POS) | |
| range of heliocentric distances | 1.07 au – 5.82au | |
| type of model of motion | NS - non-gravitational orbits for standard g(r) | |
| data weighting | YES | |
| number of residuals | 1072 | |
| RMS [arcseconds] | 0.54 | |
| orbit quality class | 1b | |
| orbital elements (barycentric ecliptic J2000) | ||
|---|---|---|
| Epoch | 2309 11 13 | |
| perihelion date | 2008 09 29.20856959 | ± 0.00018051 |
| perihelion distance [au] | 1.06952611 | ± 0.00000546 |
| eccentricity | 0.99973634 | ± 0.00000302 |
| argument of perihelion [°] | 348.350303 | ± 0.000271 |
| ascending node [°] | 277.900870 | ± 0.000048 |
| inclination [°] | 82.577708 | ± 0.000016 |
| reciprocal semi-major axis [10-6 au-1] | 246.52 | ± 2.82 |
| file containing 5001 VCs swarm |
|---|
| 2008a1r5.bpl |
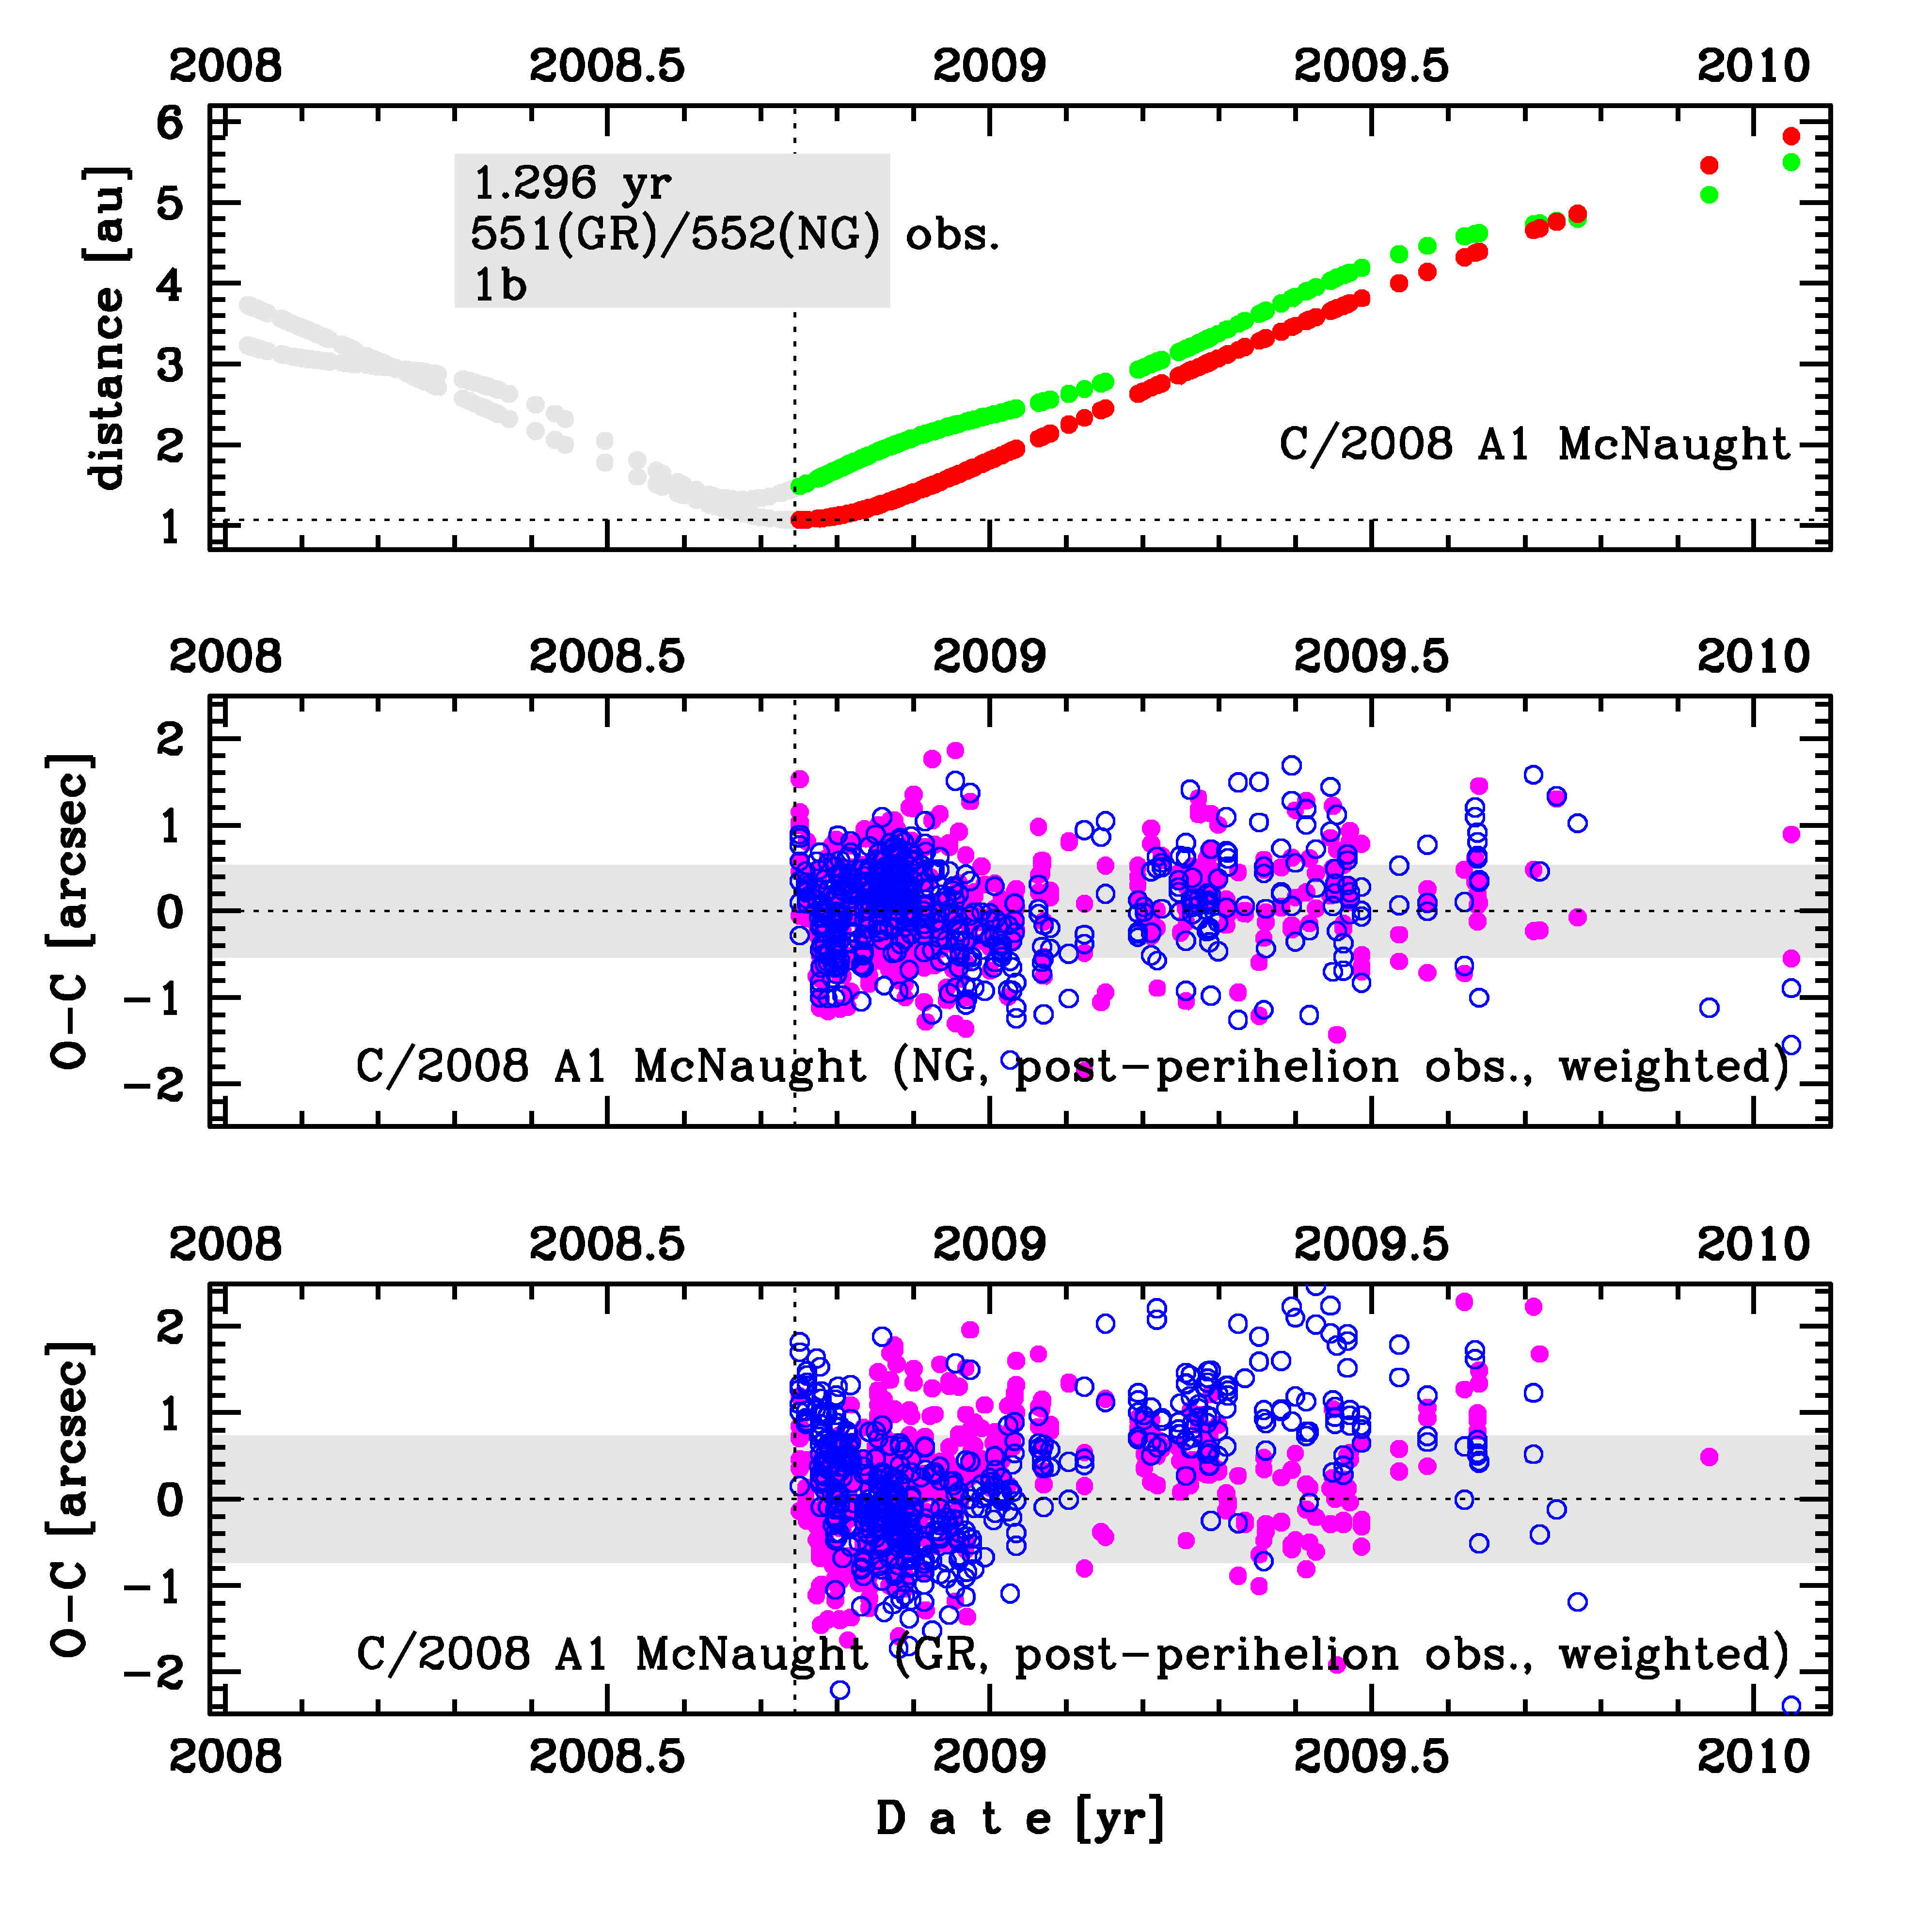
Upper panel: Time distribution of positional observations with corresponding heliocentric (red curve) and geocentric (green curve) distance at which they were taken. The horizontal dotted line shows the perihelion distance for a given comet whereas vertical dotted line — the moment of perihelion passage.
Lower panel (panels): O-C diagram for this(two) solution (solutions) given in this database, where residuals in right ascension are shown using magenta dots and in declination by blue open circles.
Lower panel (panels): O-C diagram for this(two) solution (solutions) given in this database, where residuals in right ascension are shown using magenta dots and in declination by blue open circles.

Six 2D-projections of the 6D space of future swarm including 5001 VCs. Each density map is given in logarithmic scale presented on the right in the individual panel.