C/2008 FK75 Lemmon-Siding Spring
more info
C/2008 FK75 was first discovered on 31 March 2008 in the course of the Mt.Lemmon Survey as an apparently asteroidal object. Next, independently was rediscovered by Siding Spring survey (again as apparently asteroidal) on 1 July 2008. Two days later, J. Young reported that images showed diffuse coma [IAUC 8958, 2008 July 7]; then other observers confirmed cometary appearance.
Observational arc of C/2008 FK75 covers 5.6 yr in a range of heliocentric distances: 8.24 au – 4.511 au (perihelion) – 9.51 au.
Comet had its closest approach to the Earth on 16 June 2010 (4.057 au, 2.5 months before perihelion passage, see figure).
NG orbits using full data-arc as well as independently using pre-perihelion and post-perihelion data are determinable.
This Oort spike comet suffers a small planetary perturbations during its passage through the planetary system that lead to escape of the comet from the solar system on hiperbolic orbit (see future barycentric orbit).
See also Królikowska and Dones 2023 and Królikowska and Dybczyński 2017.
| solution description | ||
|---|---|---|
| number of observations | 3702 | |
| data interval | 2008 03 31 – 2013 11 06 | |
| data type | perihelion within the observation arc (FULL) | |
| data arc selection | entire data set (STD) | |
| range of heliocentric distances | 8.24 au – 4.51 au (perihelion) – 9.51 au | |
| type of model of motion | NC - non-gravitational orbits for symmetric CO-g(r)-like function | |
| data weighting | YES | |
| number of residuals | 7376 | |
| RMS [arcseconds] | 0.48 | |
| orbit quality class | 1a+ | |
| orbital elements (barycentric ecliptic J2000) | ||
|---|---|---|
| Epoch | 2314 02 20 | |
| perihelion date | 2010 09 30.24029512 | ± 0.00028134 |
| perihelion distance [au] | 4.50753802 | ± 0.00000121 |
| eccentricity | 1.00033903 | ± 0.00000130 |
| argument of perihelion [°] | 80.408981 | ± 0.000042 |
| ascending node [°] | 218.247732 | ± 0.000005 |
| inclination [°] | 61.190648 | ± 0.000003 |
| reciprocal semi-major axis [10-6 au-1] | -75.21 | ± 0.29 |
| file containing 5001 VCs swarm |
|---|
| 2008fkc6.bpl |
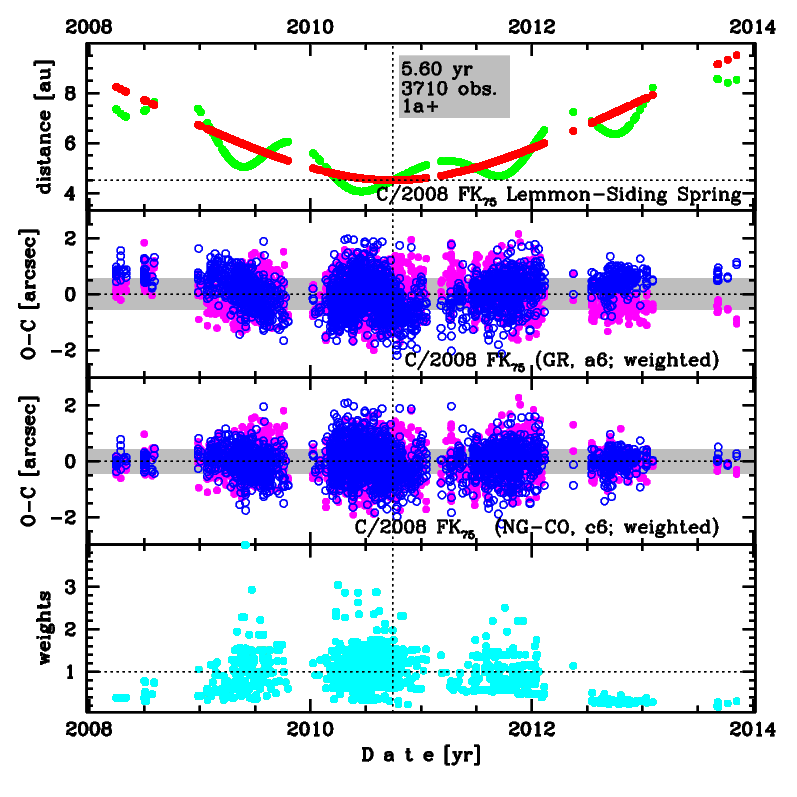
Upper panel: Time distribution of positional observations with corresponding heliocentric (red curve) and geocentric (green curve) distance at which they were taken. The horizontal dotted line shows the perihelion distance for a given comet whereas vertical dotted line — the moment of perihelion passage.
Middle panel(s): O-C diagram for a given solution (sometimes in comparison to another solution available in CODE), where residuals in right ascension are shown using magenta dots and in declination by blue open circles.
Lowest panel: Relative weights for a given data set(s).
Middle panel(s): O-C diagram for a given solution (sometimes in comparison to another solution available in CODE), where residuals in right ascension are shown using magenta dots and in declination by blue open circles.
Lowest panel: Relative weights for a given data set(s).
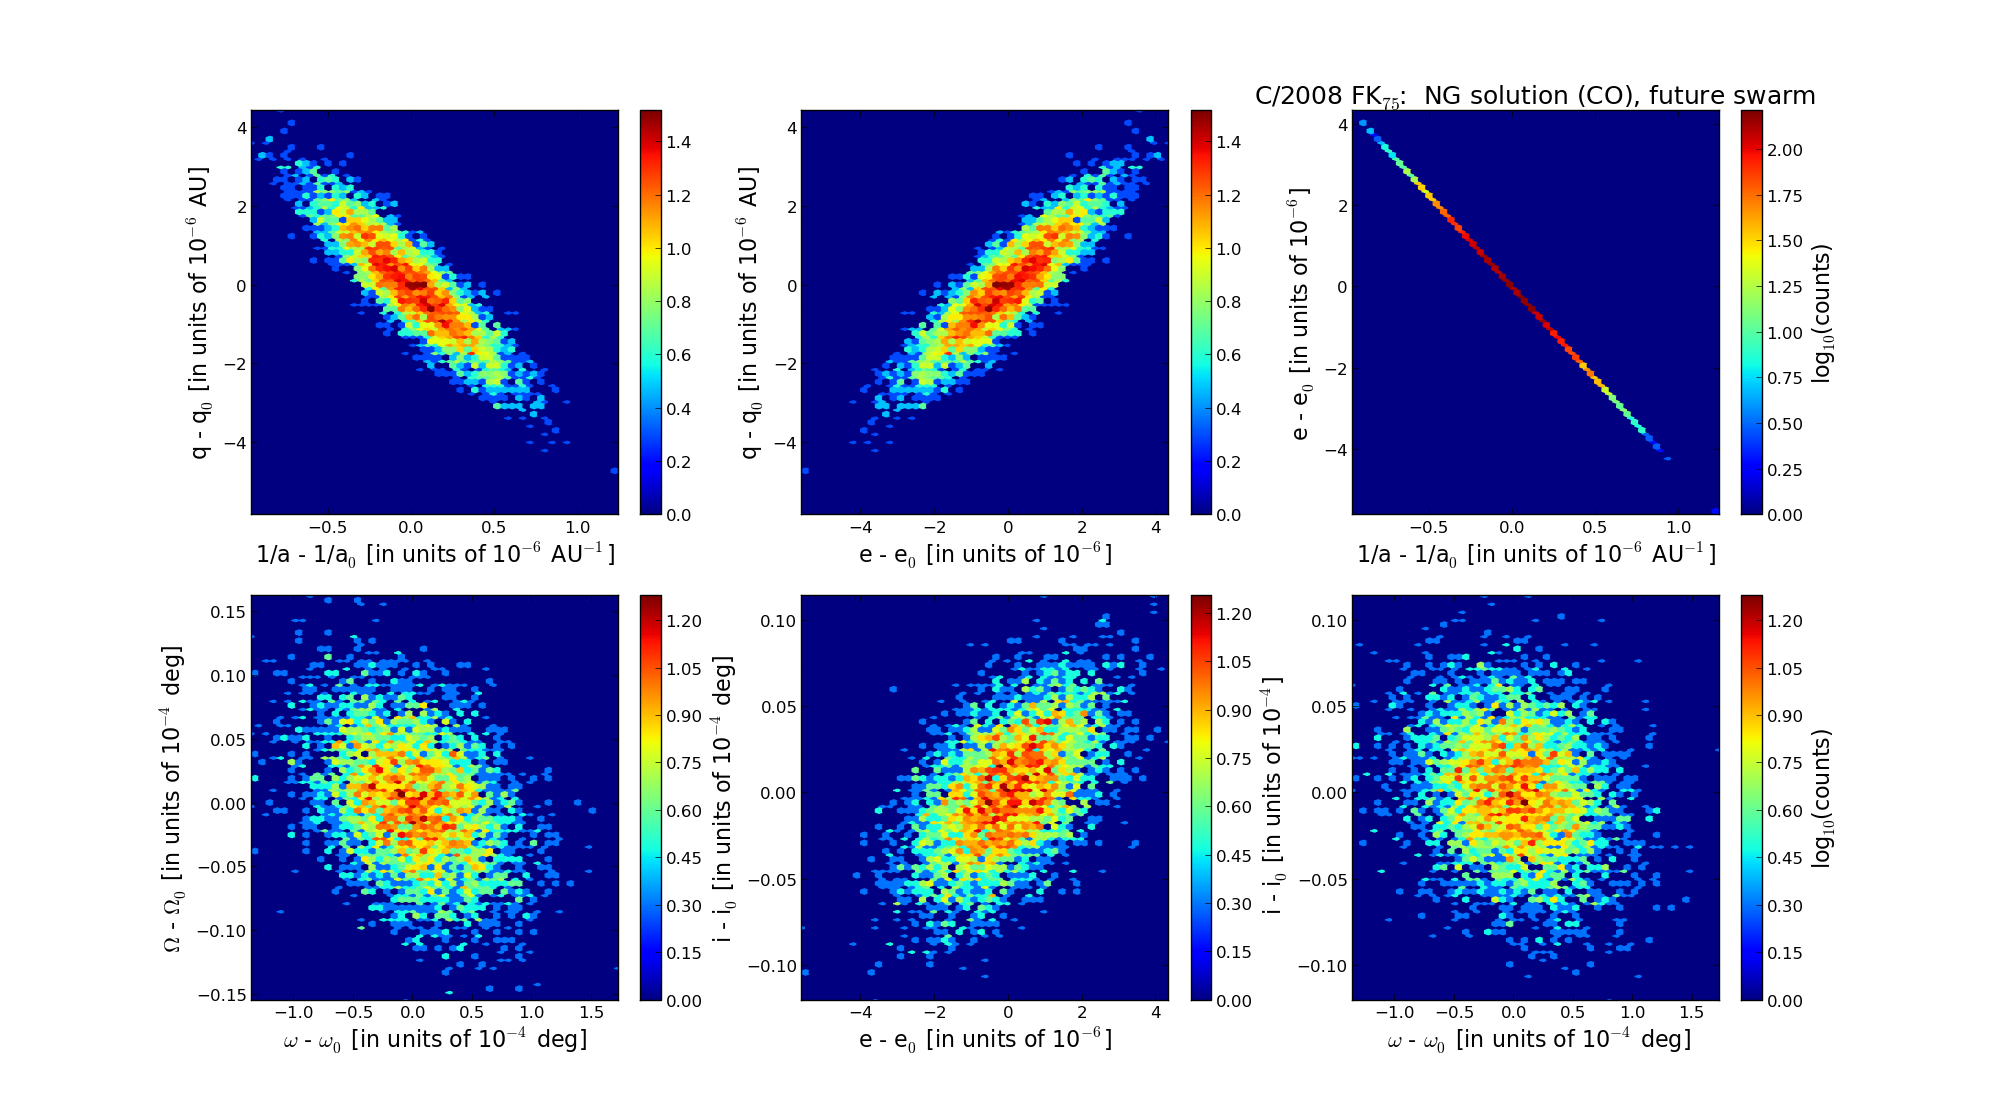
Six 2D-projections of the 6D space of future swarm including 5001 VCs. Each density map is given in logarithmic scale presented on the right in the individual panel.