C/2008 FK75 Lemmon-Siding Spring
more info
C/2008 FK75 was first discovered on 31 March 2008 in the course of the Mt.Lemmon Survey as an apparently asteroidal object. Next, independently was rediscovered by Siding Spring survey (again as apparently asteroidal) on 1 July 2008. Two days later, J. Young reported that images showed diffuse coma [IAUC 8958, 2008 July 7]; then other observers confirmed cometary appearance.
Observational arc of C/2008 FK75 covers 5.6 yr in a range of heliocentric distances: 8.24 au – 4.511 au (perihelion) – 9.51 au.
Comet had its closest approach to the Earth on 16 June 2010 (4.057 au, 2.5 months before perihelion passage, see figure).
NG orbits using full data-arc as well as independently using pre-perihelion and post-perihelion data are determinable.
This Oort spike comet suffers a small planetary perturbations during its passage through the planetary system that lead to escape of the comet from the solar system on hiperbolic orbit (see future barycentric orbit).
See also Królikowska and Dones 2023 and Królikowska and Dybczyński 2017.
| solution description | ||
|---|---|---|
| number of observations | 2338 | |
| data interval | 2008 03 31 – 2010 09 29 | |
| data arc selection | data generally limited to pre-perihelion (PRE) | |
| range of heliocentric distances | 8.24 au – 4.51 au (perihelion) – 4.51 au | |
| type of model of motion | NC - non-gravitational orbits for symmetric CO-g(r)-like function | |
| data weighting | YES | |
| number of residuals | 4748 | |
| RMS [arcseconds] | 0.40 | |
| orbit quality class | 1a+ | |
| previous orbit statistics, both Galactic and stellar perturbations were taken into account | ||
|---|---|---|
| no. of returning VCs in the swarm | 4999 | * |
| no. of escaping VCs in the swarm | 2 | |
| no. of hyperbolas among escaping VCs in the swarm | 0 | |
| previous reciprocal semi-major axis [10-6 au-1] | 18.30 – 19.61 – 20.90 | R |
| previous perihelion distance [au] | 2620 – 2830 – 3050 | R |
| previous aphelion distance [103 au] | 93.1 – 99.1 – 106 | R |
| time interval to previous perihelion [Myr] | 10 – 11 – 12.3 | R |
| percentage of VCs with qprev > 20 | 100 | |
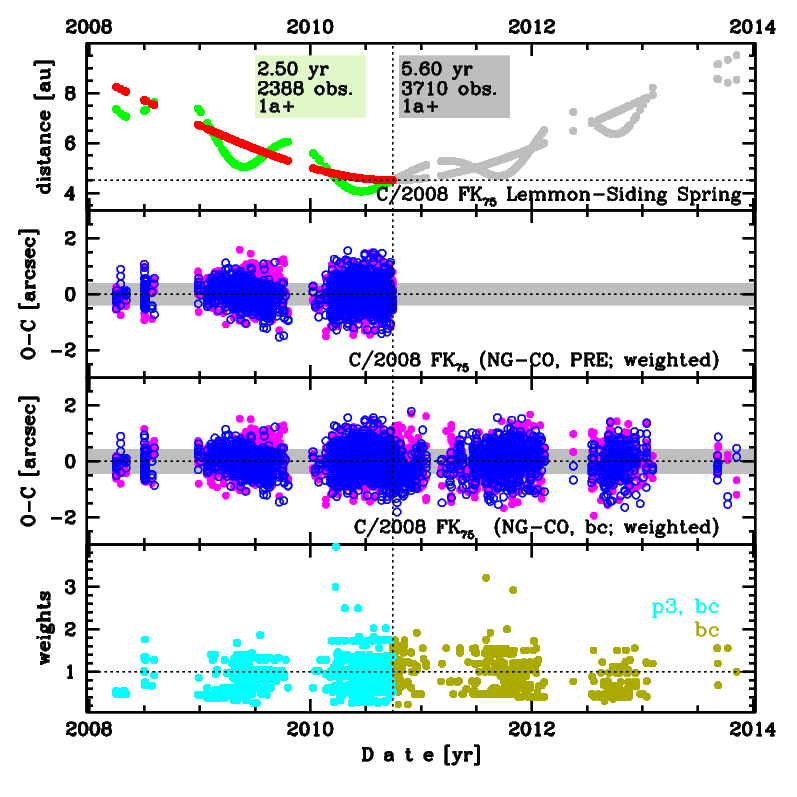
Upper panel: Time distribution of positional observations with corresponding heliocentric (red curve) and geocentric (green curve) distance at which they were taken. The horizontal dotted line shows the perihelion distance for a given comet whereas vertical dotted line — the moment of perihelion passage.
Middle panel(s): O-C diagram for a given solution (sometimes in comparison to another solution available in CODE), where residuals in right ascension are shown using magenta dots and in declination by blue open circles.
Lowest panel: Relative weights for a given data set(s).
Middle panel(s): O-C diagram for a given solution (sometimes in comparison to another solution available in CODE), where residuals in right ascension are shown using magenta dots and in declination by blue open circles.
Lowest panel: Relative weights for a given data set(s).
| previous_g orbit statistics, here only the Galactic tide has been included | ||
|---|---|---|
| no. of returning VCs in the swarm | 4458 | * |
| no. of escaping VCs in the swarm | 543 | |
| no. of hyperbolas among escaping VCs in the swarm | 0 | |
| previous reciprocal semi-major axis [10-6 au-1] | 17.01 – 18.13 – 19.53 | R |
| previous perihelion distance [au] | 160 – 270 – 410 | R |
| previous aphelion distance [103 au] | 102 – 110 – 117 | R |
| time interval to previous perihelion [Myr] | 11.4 – 12.7 – 14 | R |
| percentage of VCs with qprev > 20 | 100 | |