C/2008 T2 Cardinal
more info
Comet C/2008 T2 was discovered on 1 October 2008 by Rob D. Cardinal (University of Calgary, Priddis); that is about 8.5 months before its perihelion passage. The comet was observed until 9 September 2009.
Comet had its closest approach to the Earth on 20 March 2009 (1.727 au), about 3 months before its perihelion passage.
Preferred solution given here is based on entire data set spanning over 0.939 yr in a range of heliocentric distances: 3.60 au – 1.202 au (perihelion) – 1.78 au; however, the radial component of this non-gravitational solution is negative.
This Oort spike comet suffers small planetary perturbations during its passage through the planetary system; these perturbations lead to more tight future orbit (see future barycentric orbits).
See also Królikowska and Dybczyński 2013 and Królikowska 2020.
| solution description | ||
|---|---|---|
| number of observations | 1323 | |
| data interval | 2008 10 01 – 2009 09 09 | |
| data type | significantly more measurements before perihelion (PRE+) | |
| data arc selection | entire data set (STD) | |
| range of heliocentric distances | 3.6 au – 1.20 au (perihelion) – 1.78 au | |
| type of model of motion | NS - non-gravitational orbits for standard g(r) | |
| data weighting | YES | |
| number of residuals | 2611 | |
| RMS [arcseconds] | 0.39 | |
| orbit quality class | 1b | |
| orbital elements (barycentric ecliptic J2000) | ||
|---|---|---|
| Epoch | 2310 07 06 | |
| perihelion date | 2009 06 14.09280275 | ± 0.00010057 |
| perihelion distance [au] | 1.20128909 | ± 0.00000256 |
| eccentricity | 0.99973716 | ± 0.00000940 |
| argument of perihelion [°] | 215.845886 | ± 0.000121 |
| ascending node [°] | 309.656388 | ± 0.000054 |
| inclination [°] | 56.291838 | ± 0.000024 |
| reciprocal semi-major axis [10-6 au-1] | 218.80 | ± 7.83 |
| file containing 5001 VCs swarm |
|---|
| 2008t2n5.bpl |
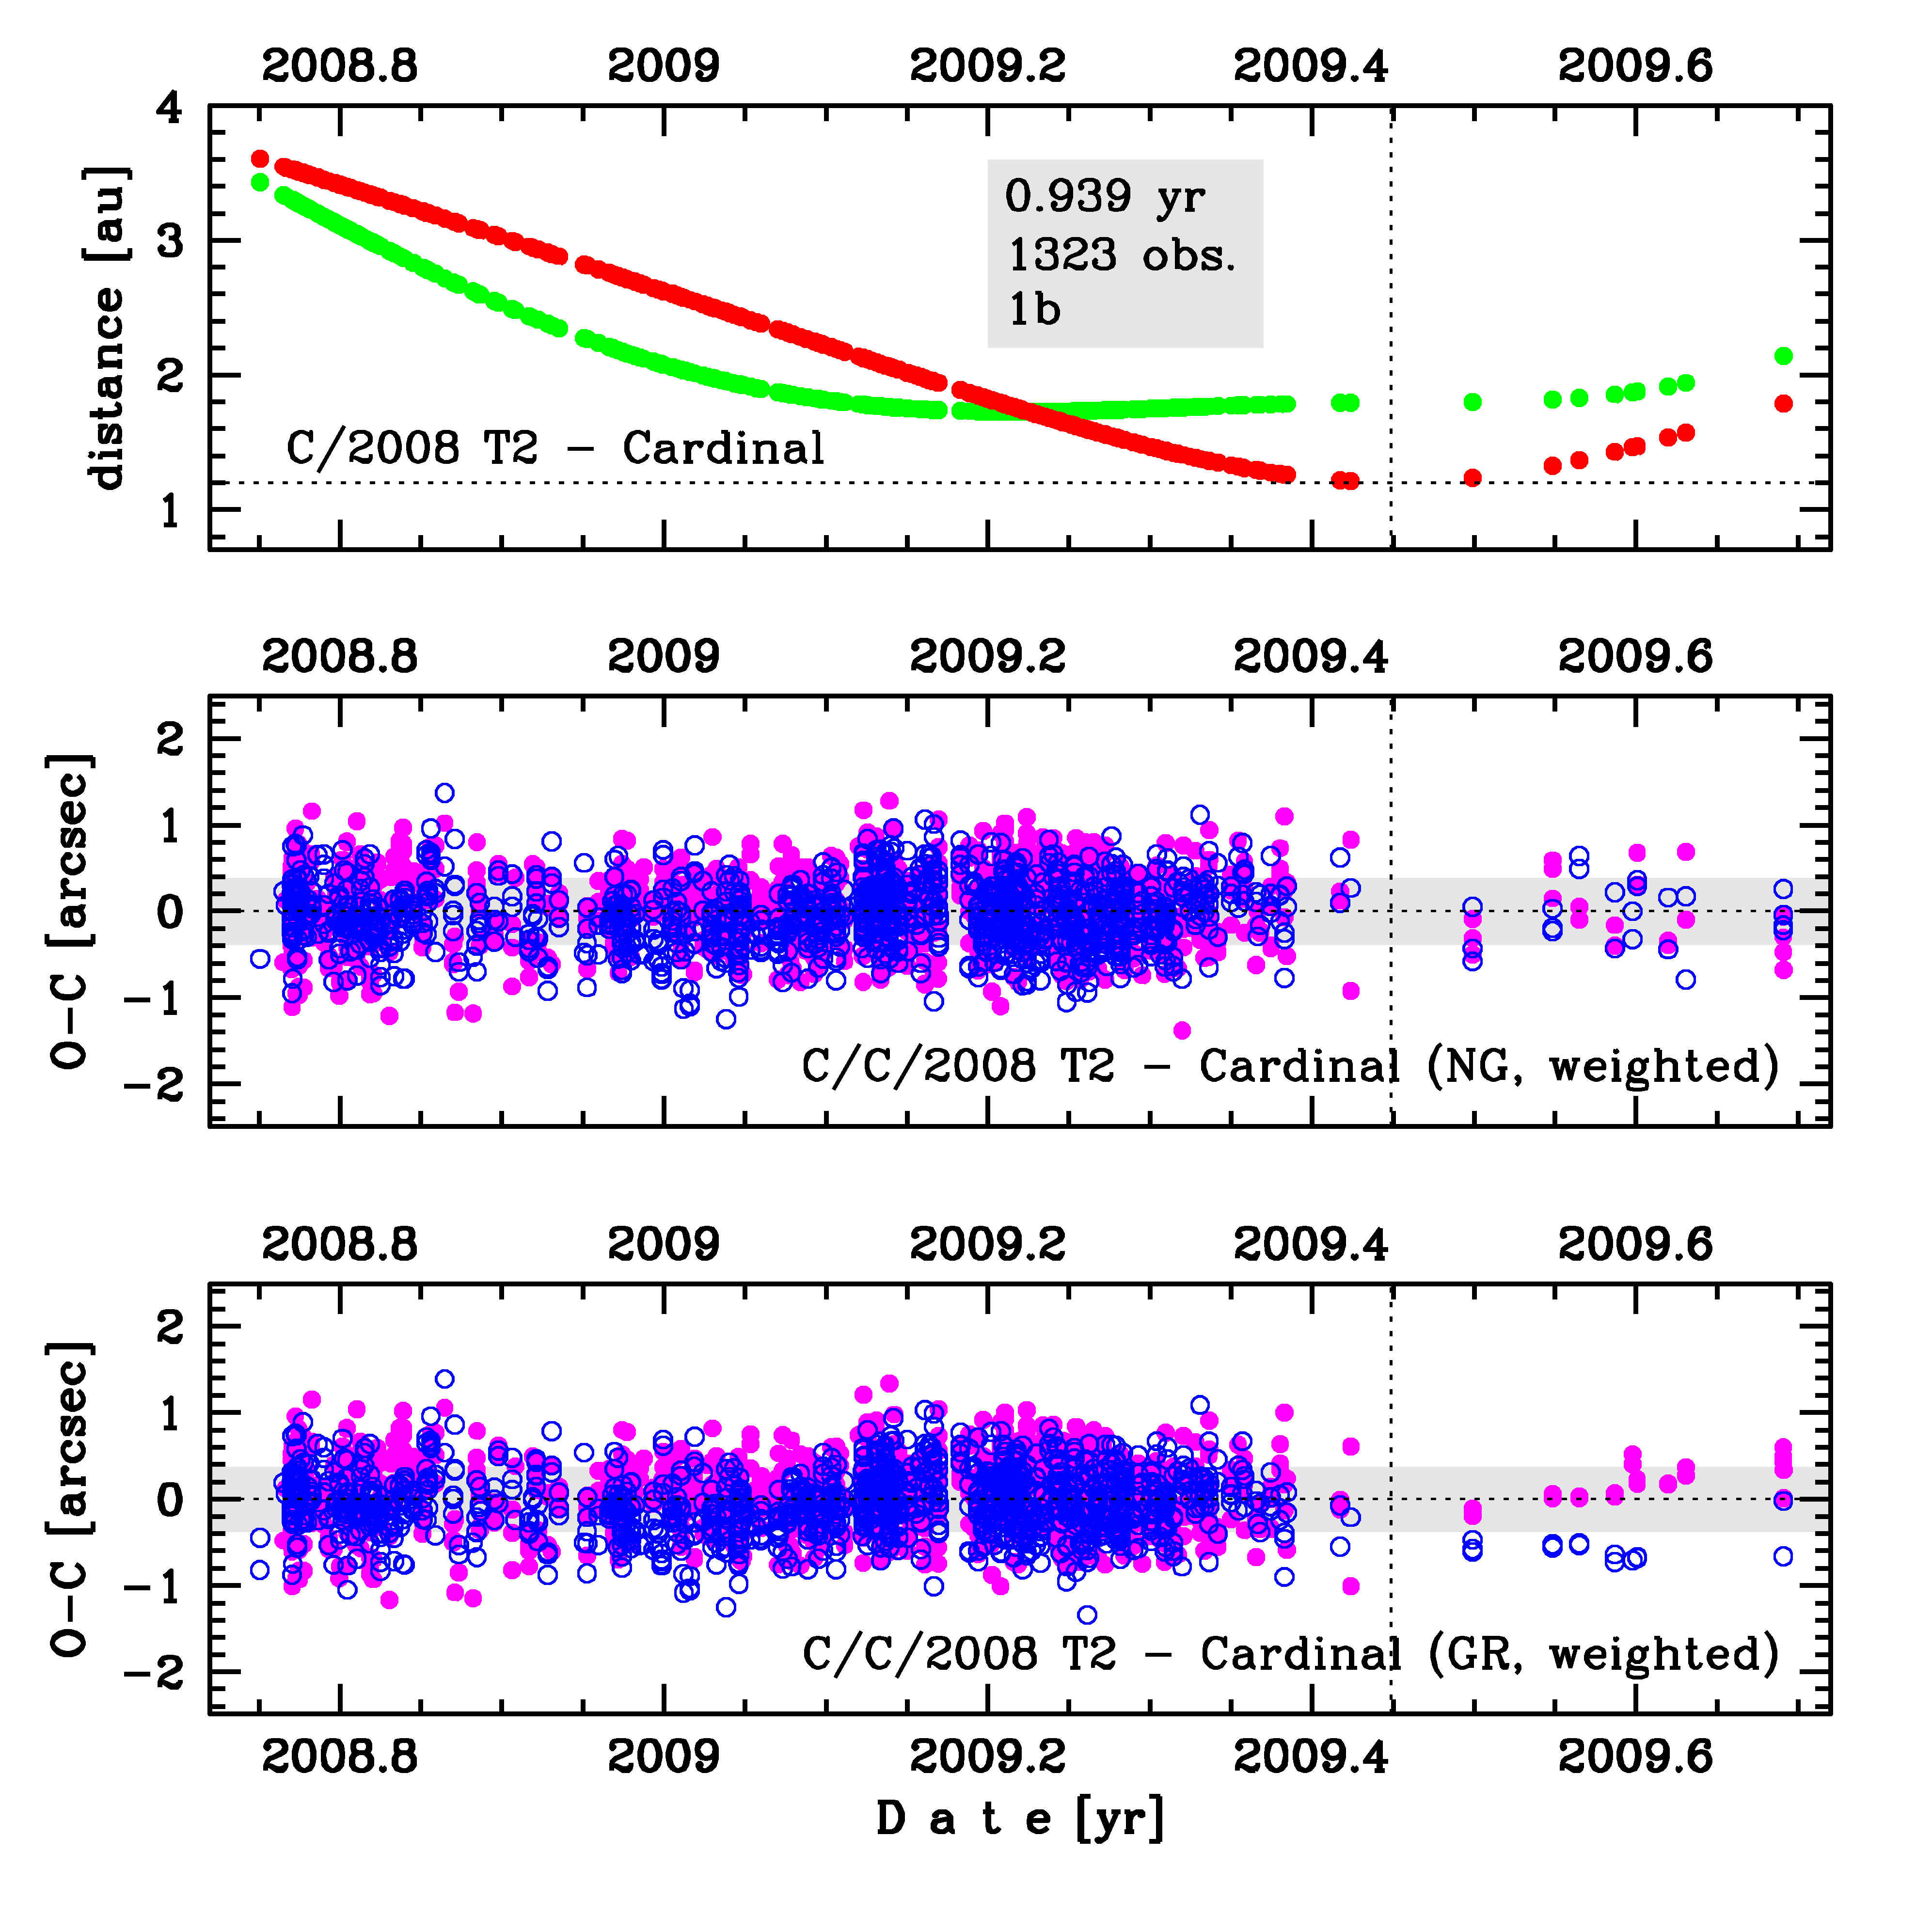
Upper panel: Time distribution of positional observations with corresponding heliocentric (red curve) and geocentric (green curve) distance at which they were taken. The horizontal dotted line shows the perihelion distance for a given comet whereas vertical dotted line — the moment of perihelion passage.
Lower panel (panels): O-C diagram for this(two) solution (solutions) given in this database, where residuals in right ascension are shown using magenta dots and in declination by blue open circles.
Lower panel (panels): O-C diagram for this(two) solution (solutions) given in this database, where residuals in right ascension are shown using magenta dots and in declination by blue open circles.
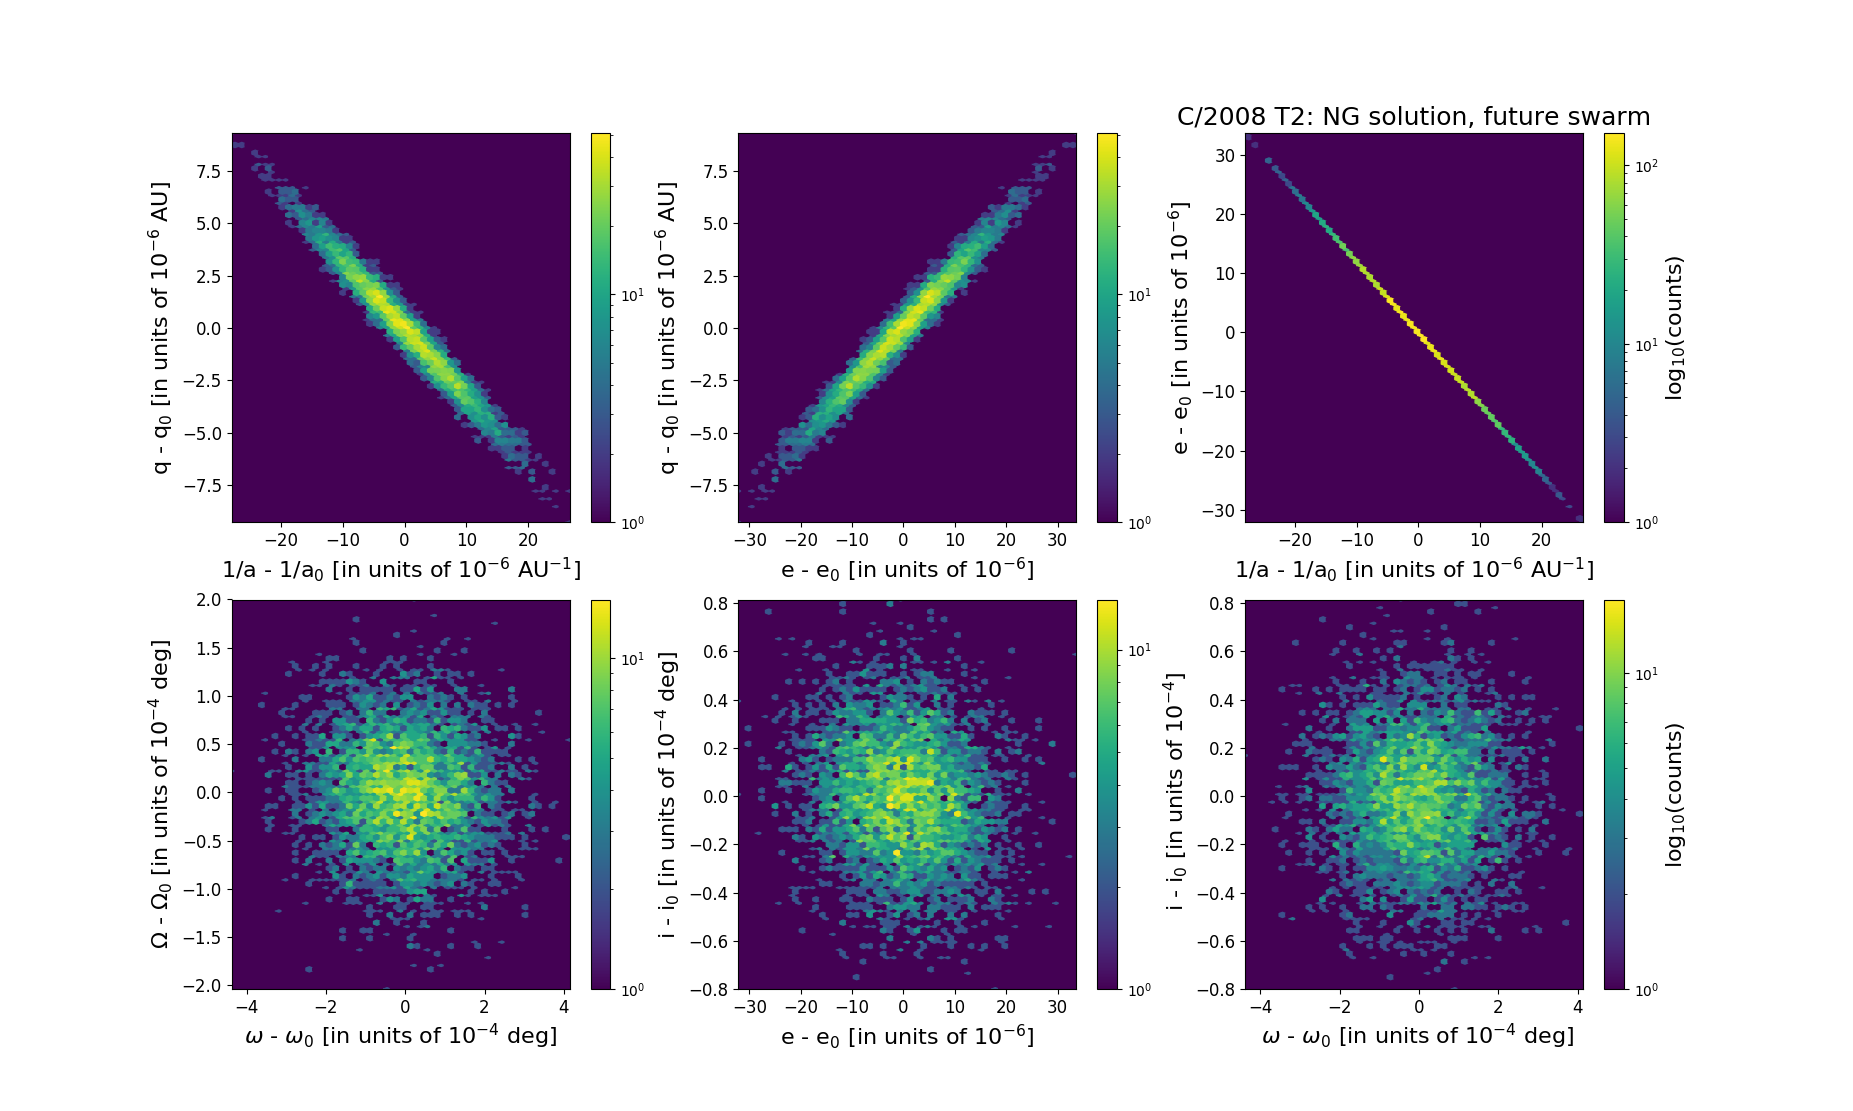
Six 2D-projections of the 6D space of future swarm including 5001 VCs. Each density map is given in logarithmic scale presented on the right in the individual panel.