C/2009 UG89 Lemmon
more info
C/2009 UG89 was discovered on 22 October 2009 by Albert D. Grauer as an apparently asteroidal object (Mt Lemmon); CCD images taken by observers in April 2010 revealed a cometary activity [IAUC 9141, 2010 April 27]. C/2009 UG89 passed perihelion in December 2010.
This comet was followed by 2.5 yr during four oppositions in a range of heliocentric distances: 5.30 au – 3.931 au (perihelion) – 5.73 au.
C/2009 UG89 had its closest approach to the Earth on 23 July 2010 (3.253 au, almost five months before perihelion passage).
The comet passed close to Jupiter one year and three months before perihelion passage (0.499 au, 23 September 2009, one month before discovery).
Therefore, this comet suffers large planetary perturbations during its passage through the planetary system that lead to escape of the comet from the solar system on hyperbolic orbit (see future barycentric orbit).
See also Królikowska and Dybczyński 2017.
| solution description | ||
|---|---|---|
| number of observations | 988 | |
| data interval | 2009 10 22 – 2012 04 27 | |
| data type | perihelion within the observation arc (FULL) | |
| data arc selection | entire data set (STD) | |
| range of heliocentric distances | 5.3 au – 3.93 au (perihelion) – 5.73 au | |
| detectability of NG effects in the comet's motion | NG effects not determinable | |
| type of model of motion | GR - gravitational orbit | |
| data weighting | YES | |
| number of residuals | 1938 | |
| RMS [arcseconds] | 0.43 | |
| orbit quality class | 1a+ | |
| next orbit statistics, both Galactic and stellar perturbations were taken into account | ||
|---|---|---|
| no. of returning VCs in the swarm | 0 | |
| no. of escaping VCs in the swarm | 5001 | |
| no. of hyperbolas among escaping VCs in the swarm | 5001 | * |
| next reciprocal semi-major axis [10-6 au-1] | -1,432.60 – -1,432.00 – -1,431.39 | |
| next perihelion distance [au] | 2.3855 – 2.3858 – 2.3862 | |
| synchronous stop epoch [Myr] | 0.495 | S |
| percentage of VCs with qnext < 10 | 100 | |
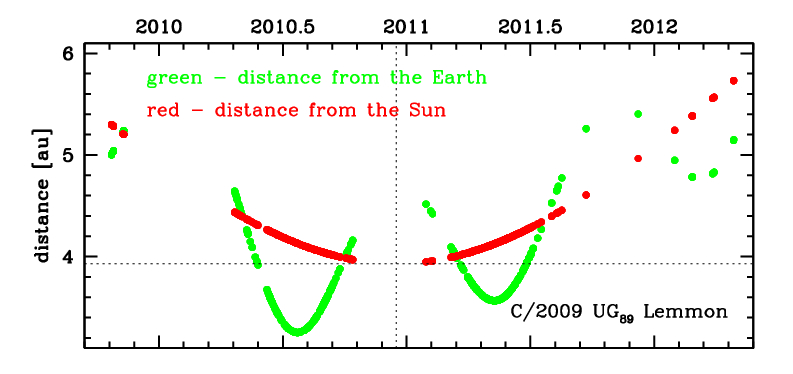
Time distribution of positional observations with corresponding heliocentric (red curve) and geocentric (green curve) distance at which they were taken. The horizontal dotted line shows the perihelion distance for a given comet whereas vertical dotted line — the moment of perihelion passage.
| next_g orbit statistics, here only the Galactic tide has been included | ||
|---|---|---|
| no. of returning VCs in the swarm | 0 | |
| no. of escaping VCs in the swarm | 5001 | |
| no. of hyperbolas among escaping VCs in the swarm | 5001 | * |
| next reciprocal semi-major axis [10-6 au-1] | -1,432.65 – -1,432.04 – -1,431.44 | |
| next perihelion distance [au] | 2.636 – 2.6363 – 2.6366 | |
| synchronous stop epoch [Myr] | 0.506 | S |
| percentage of VCs with qnext < 10 | 100 | |