C/2010 H1 Garradd
more info
Comet C/2010 H1 was discovered on 16 April 2010 by Gordon J. Garradd (Siding Spring Survey); that is about 2 months before its perihelion passage. A few pre-discovery images of this comet taken on 19 February 2010 during Siding Spring Survey were found. The comet was observed until 2 July 2010.
Comet had its closest approach to the Earth on 9 April 2010 (1.924 au), about a week before its discovery.
Solution given here is based on data spanning over 0.375 yr in a narrow range of heliocentric distances: 3.01 au – 2.746 au (perihelion) – 2.75 au.
This Oort spike comet suffers moderate planetary perturbations during its passage through the planetary system, these perturbations lead to a more tight future orbit of about 1,800 au.
See also Królikowska and Dybczyński 2013 and Królikowska 2020.
| solution description | ||
|---|---|---|
| number of observations | 51 | |
| data interval | 2010 02 19 – 2010 07 02 | |
| data type | perihelion within the observation arc (FULL) | |
| data arc selection | entire data set (STD) | |
| range of heliocentric distances | 3.01 au – 2.75 au (perihelion) – 2.75 au | |
| detectability of NG effects in the comet's motion | NG effects not determinable | |
| type of model of motion | GR - gravitational orbit | |
| data weighting | NO | |
| number of residuals | 86 | |
| RMS [arcseconds] | 0.62 | |
| orbit quality class | 2b | |
| previous orbit statistics, both Galactic and stellar perturbations were taken into account | ||
|---|---|---|
| no. of returning VCs in the swarm | 895 | |
| no. of escaping VCs in the swarm | 4106 | * |
| no. of hyperbolas among escaping VCs in the swarm | 537 | |
| previous reciprocal semi-major axis [10-6 au-1] | -0.26 – 8.68 – 17.25 | |
| previous perihelion distance [au] | 0.35 – 0.79 – 1.5 | |
| previous aphelion distance [103 au] | 110 – 210 – 700 | |
| time interval to previous perihelion [Myr] | 2.43 ± 11 | |
| percentage of VCs with qprev < 10 | 100 | |
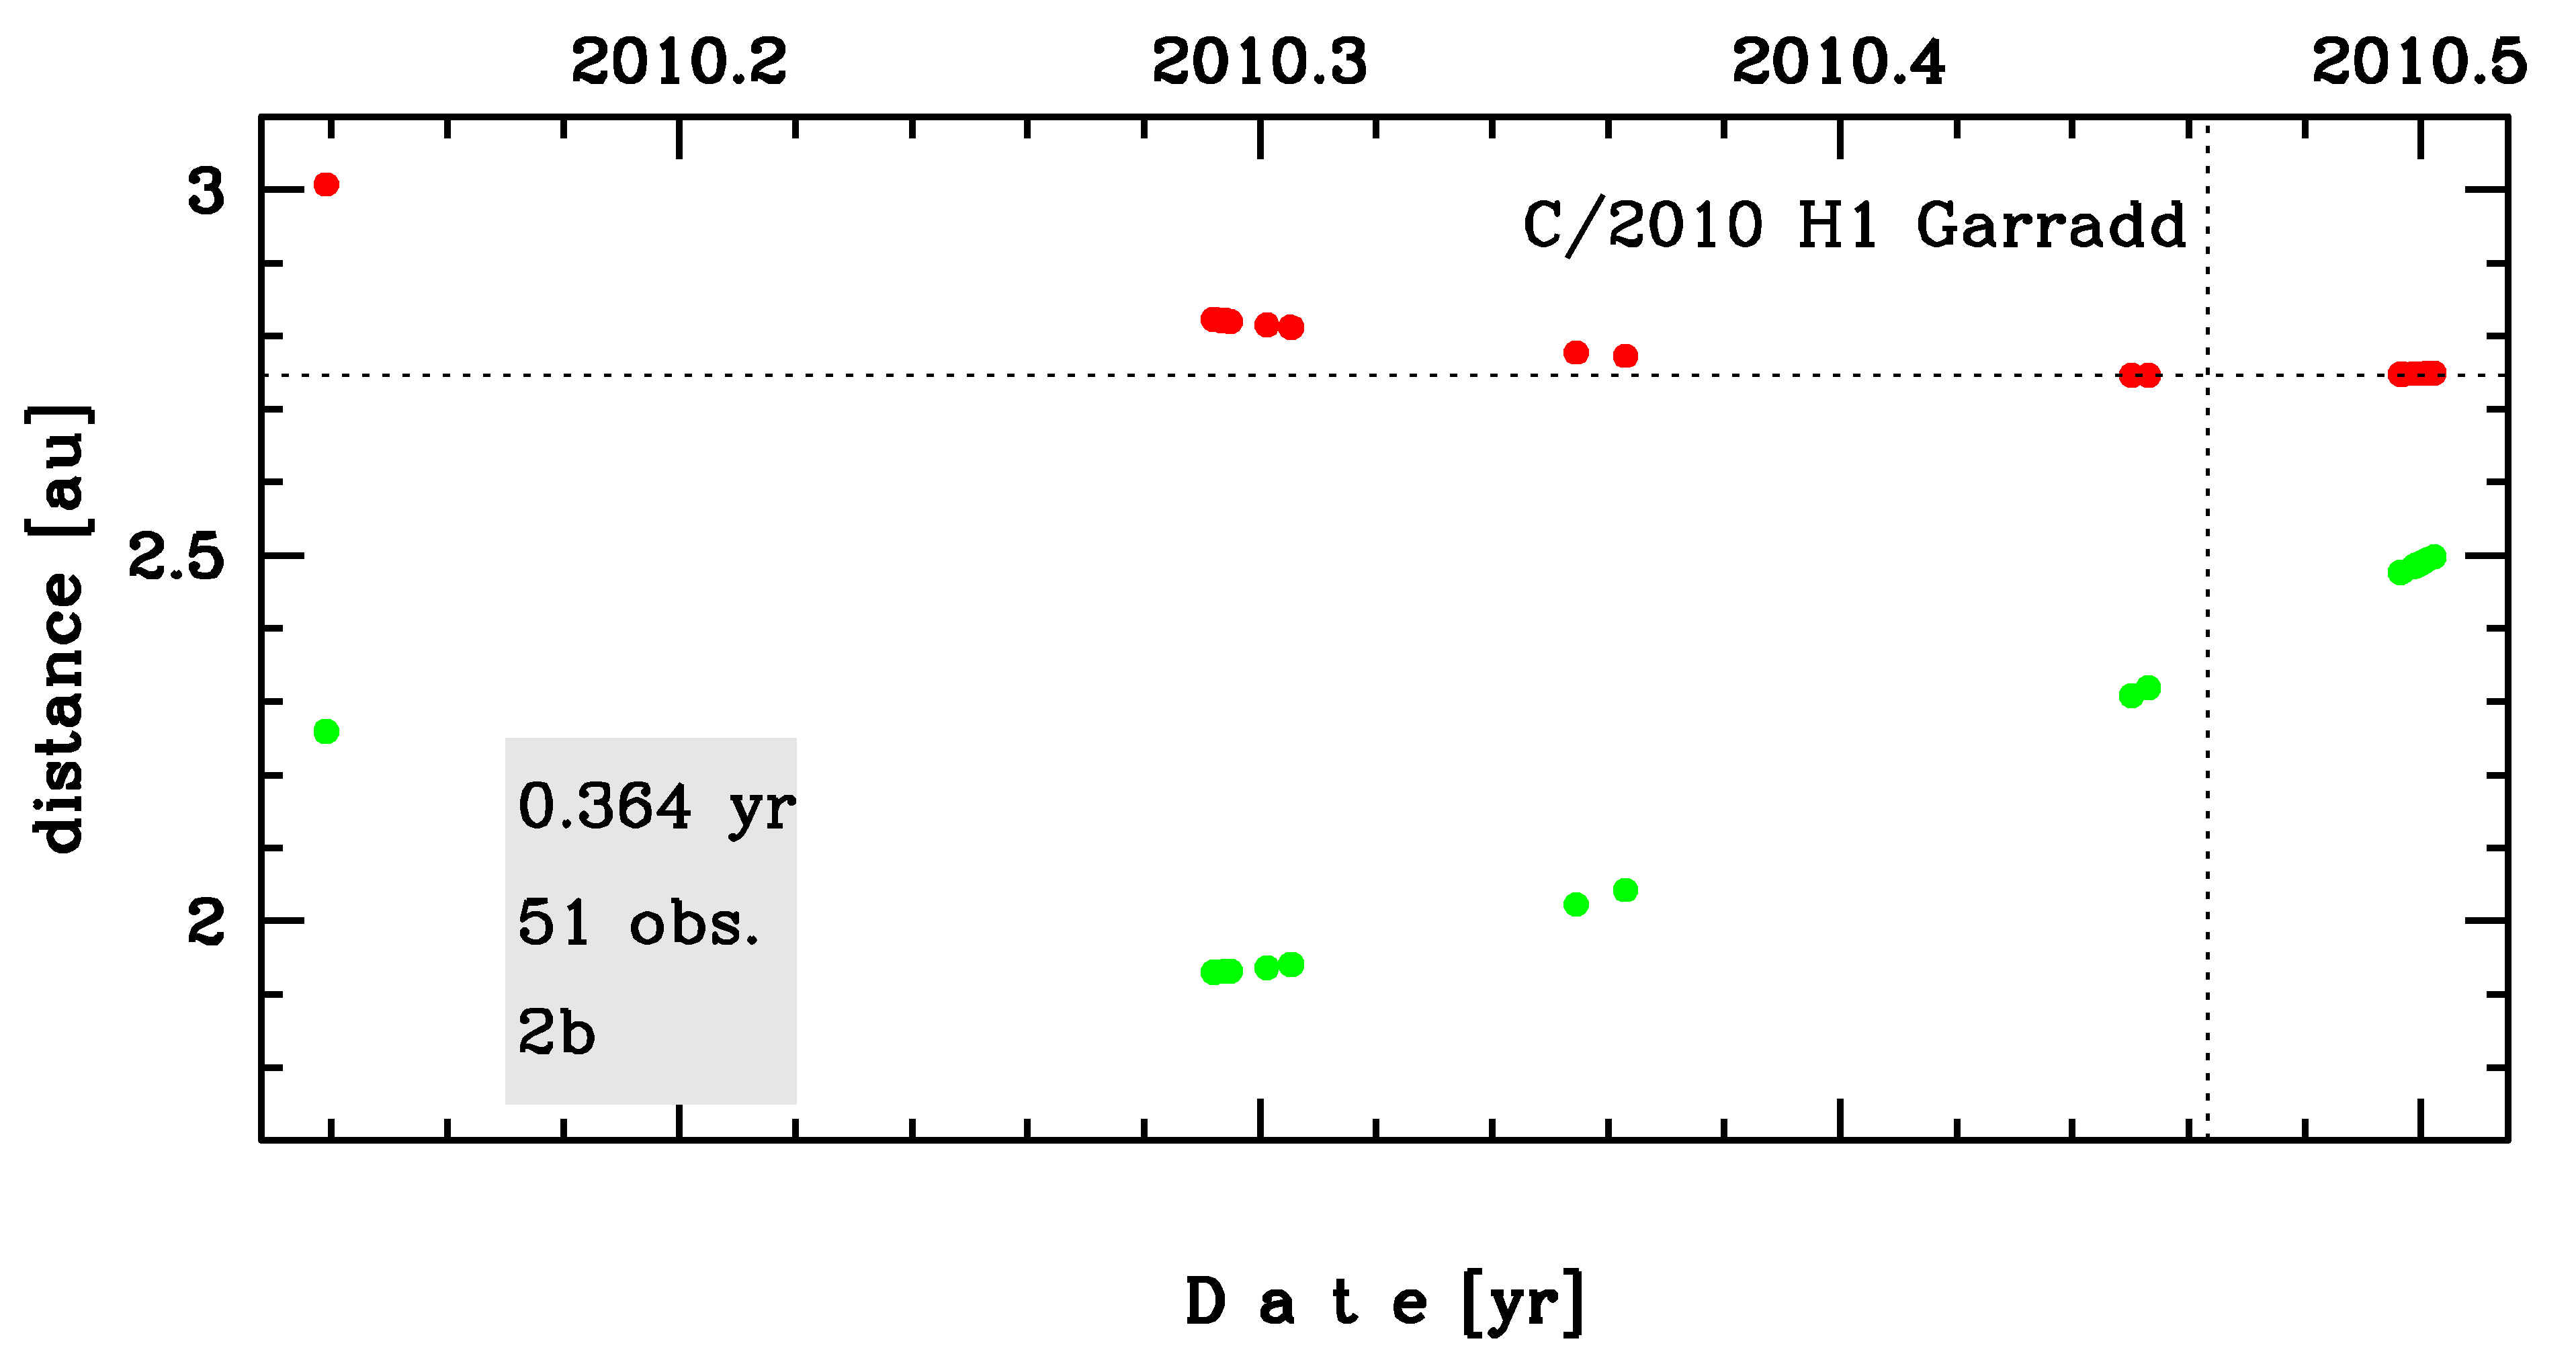
Time distribution of positional observations with corresponding heliocentric (red curve) and geocentric (green curve) distance at which they were taken. The horizontal dotted line shows the perihelion distance for a given comet whereas vertical dotted line — the moment of perihelion passage.
| previous_g orbit statistics, here only the Galactic tide has been included | ||
|---|---|---|
| no. of returning VCs in the swarm | 623 | |
| no. of escaping VCs in the swarm | 4378 | * |
| no. of hyperbolas among escaping VCs in the swarm | 519 | |
| previous reciprocal semi-major axis [10-6 au-1] | -0.14 – 8.77 – 17.32 | |
| previous perihelion distance [au] | 0.18 – 0.48 – 1.1 | |
| previous aphelion distance [103 au] | 110 – 210 – 700 | |
| time interval to previous perihelion [Myr] | 2.45 ± 11 | |
| percentage of VCs with qprev < 10 | 100 | |