C/2010 R1 LINEAR
more info
Comet C/2010 R1 was discovered on 4 September 2010 and next observed 3.6 yr in a range of heliocentric distances: 7.15 au – 5.621 au (perihelion) – 7.40 au. At the moment of discovery, it was 1.7 yr before perihelion passage (see figure).
Comet had its closest approach to the Earth on 10 May 2012 (4.694 au, eight days before perihelion).
This Oort spike comet suffers a tiny planetary perturbations during its passage through the planetary system.
See also Królikowska and Dones 2023 and Królikowska and Dybczyński 2017.
Comet had its closest approach to the Earth on 10 May 2012 (4.694 au, eight days before perihelion).
This Oort spike comet suffers a tiny planetary perturbations during its passage through the planetary system.
See also Królikowska and Dones 2023 and Królikowska and Dybczyński 2017.
| solution description | ||
|---|---|---|
| number of observations | 826 | |
| data interval | 2012 05 18 – 2014 03 30 | |
| data arc selection | data generally limited to post-perihelion (POS) | |
| range of heliocentric distances | 5.62 au – 5.62 au (perihelion) – 7.4 au | |
| detectability of NG effects in the comet's motion | NG effects not determinable | |
| type of model of motion | GR - gravitational orbit | |
| data weighting | YES | |
| number of residuals | 1621 | |
| RMS [arcseconds] | 0.50 | |
| orbit quality class | 1a | |
| next orbit statistics, both Galactic and stellar perturbations were taken into account | ||
|---|---|---|
| no. of returning VCs in the swarm | 5001 | * |
| no. of escaping VCs in the swarm | 0 | |
| no. of hyperbolas among escaping VCs in the swarm | 0 | |
| next reciprocal semi-major axis [10-6 au-1] | 74.92 – 76.09 – 77.28 | |
| next perihelion distance [au] | 10.1 – 11.1 – 12.1 | |
| next aphelion distance [103 au] | 25.9 – 26.3 – 26.7 | |
| time interval to next perihelion [Myr] | 1.49 – 1.53 – 1.56 | |
| percentage of VCs with qnext < 10 | 7 | |
| percentage of VCs with 10 < qnext < 20 | 93 | |
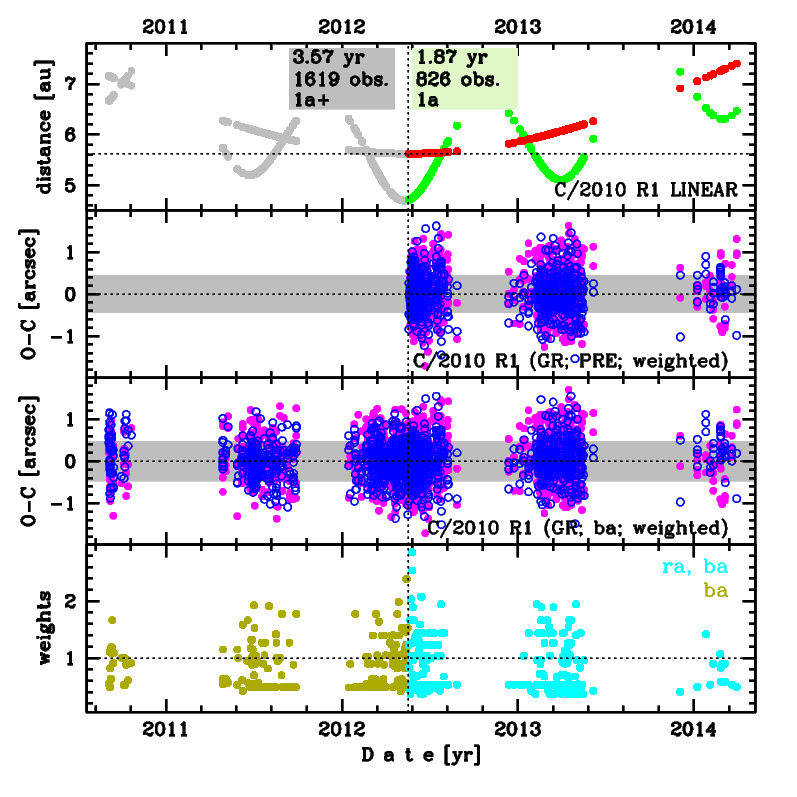
Upper panel: Time distribution of positional observations with corresponding heliocentric (red curve) and geocentric (green curve) distance at which they were taken. The horizontal dotted line shows the perihelion distance for a given comet whereas vertical dotted line — the moment of perihelion passage.
Middle panel(s): O-C diagram for a given solution (sometimes in comparison to another solution available in CODE), where residuals in right ascension are shown using magenta dots and in declination by blue open circles.
Lowest panel: Relative weights for a given data set(s).
Middle panel(s): O-C diagram for a given solution (sometimes in comparison to another solution available in CODE), where residuals in right ascension are shown using magenta dots and in declination by blue open circles.
Lowest panel: Relative weights for a given data set(s).
| next_g orbit statistics, here only the Galactic tide has been included | ||
|---|---|---|
| no. of returning VCs in the swarm | 5001 | * |
| no. of escaping VCs in the swarm | 0 | |
| no. of hyperbolas among escaping VCs in the swarm | 0 | |
| next reciprocal semi-major axis [10-6 au-1] | 74.18 – 75.31 – 76.44 | |
| next perihelion distance [au] | 4.649 – 4.695 – 4.739 | |
| next aphelion distance [103 au] | 26.2 – 26.6 – 27 | |
| time interval to next perihelion [Myr] | 1.49 – 1.53 – 1.56 | |
| percentage of VCs with qnext < 10 | 100 | |