C/2011 F1 LINEAR
more info
Comet C/2011 F1 was discovered on 17 March 2011 with Lincoln Laboratory Near-Earth Asteroid Research project; that is about a year and 10 months before its perihelion passage. The comet was observed until 7 August 2014.
Comet had its closest approach to the Earth on 6 April 2013 (2.560 au), about 3 months after its perihelion passage.
Solutions given here are based on data spanning over 3.39 yr in a range of heliocentric distances: 6.99 au – 1.819 au (perihelion) – 6.30 au.
This Oort spike comet suffers moderate planetary perturbations during its passage through the planetary system; these perturbations lead to a more tight future orbit (see future barycentric orbits).
See also Królikowska 2020.
| solution description | ||
|---|---|---|
| number of observations | 4654 | |
| data interval | 2011 03 17 – 2014 08 07 | |
| data type | perihelion within the observation arc (FULL) | |
| data arc selection | entire data set (STD) | |
| range of heliocentric distances | 6.99 au – 1.82 au (perihelion) – 6.3 au | |
| type of model of motion | NS - non-gravitational orbits for standard g(r) | |
| data weighting | YES | |
| number of residuals | 9196 | |
| RMS [arcseconds] | 0.42 | |
| orbit quality class | 1a | |
| next orbit statistics, both Galactic and stellar perturbations were taken into account | ||
|---|---|---|
| no. of returning VCs in the swarm | 5001 | * |
| no. of escaping VCs in the swarm | 0 | |
| no. of hyperbolas among escaping VCs in the swarm | 0 | |
| next reciprocal semi-major axis [10-6 au-1] | 322.22 – 326.37 – 330.42 | |
| next perihelion distance [au] | 1.81967 – 1.8197 – 1.81972 | |
| next aphelion distance [103 au] | 6.05 – 6.13 – 6.21 | |
| time interval to next perihelion [Myr] | 0.166 – 0.169 – 0.172 | |
| percentage of VCs with qnext < 10 | 100 | |
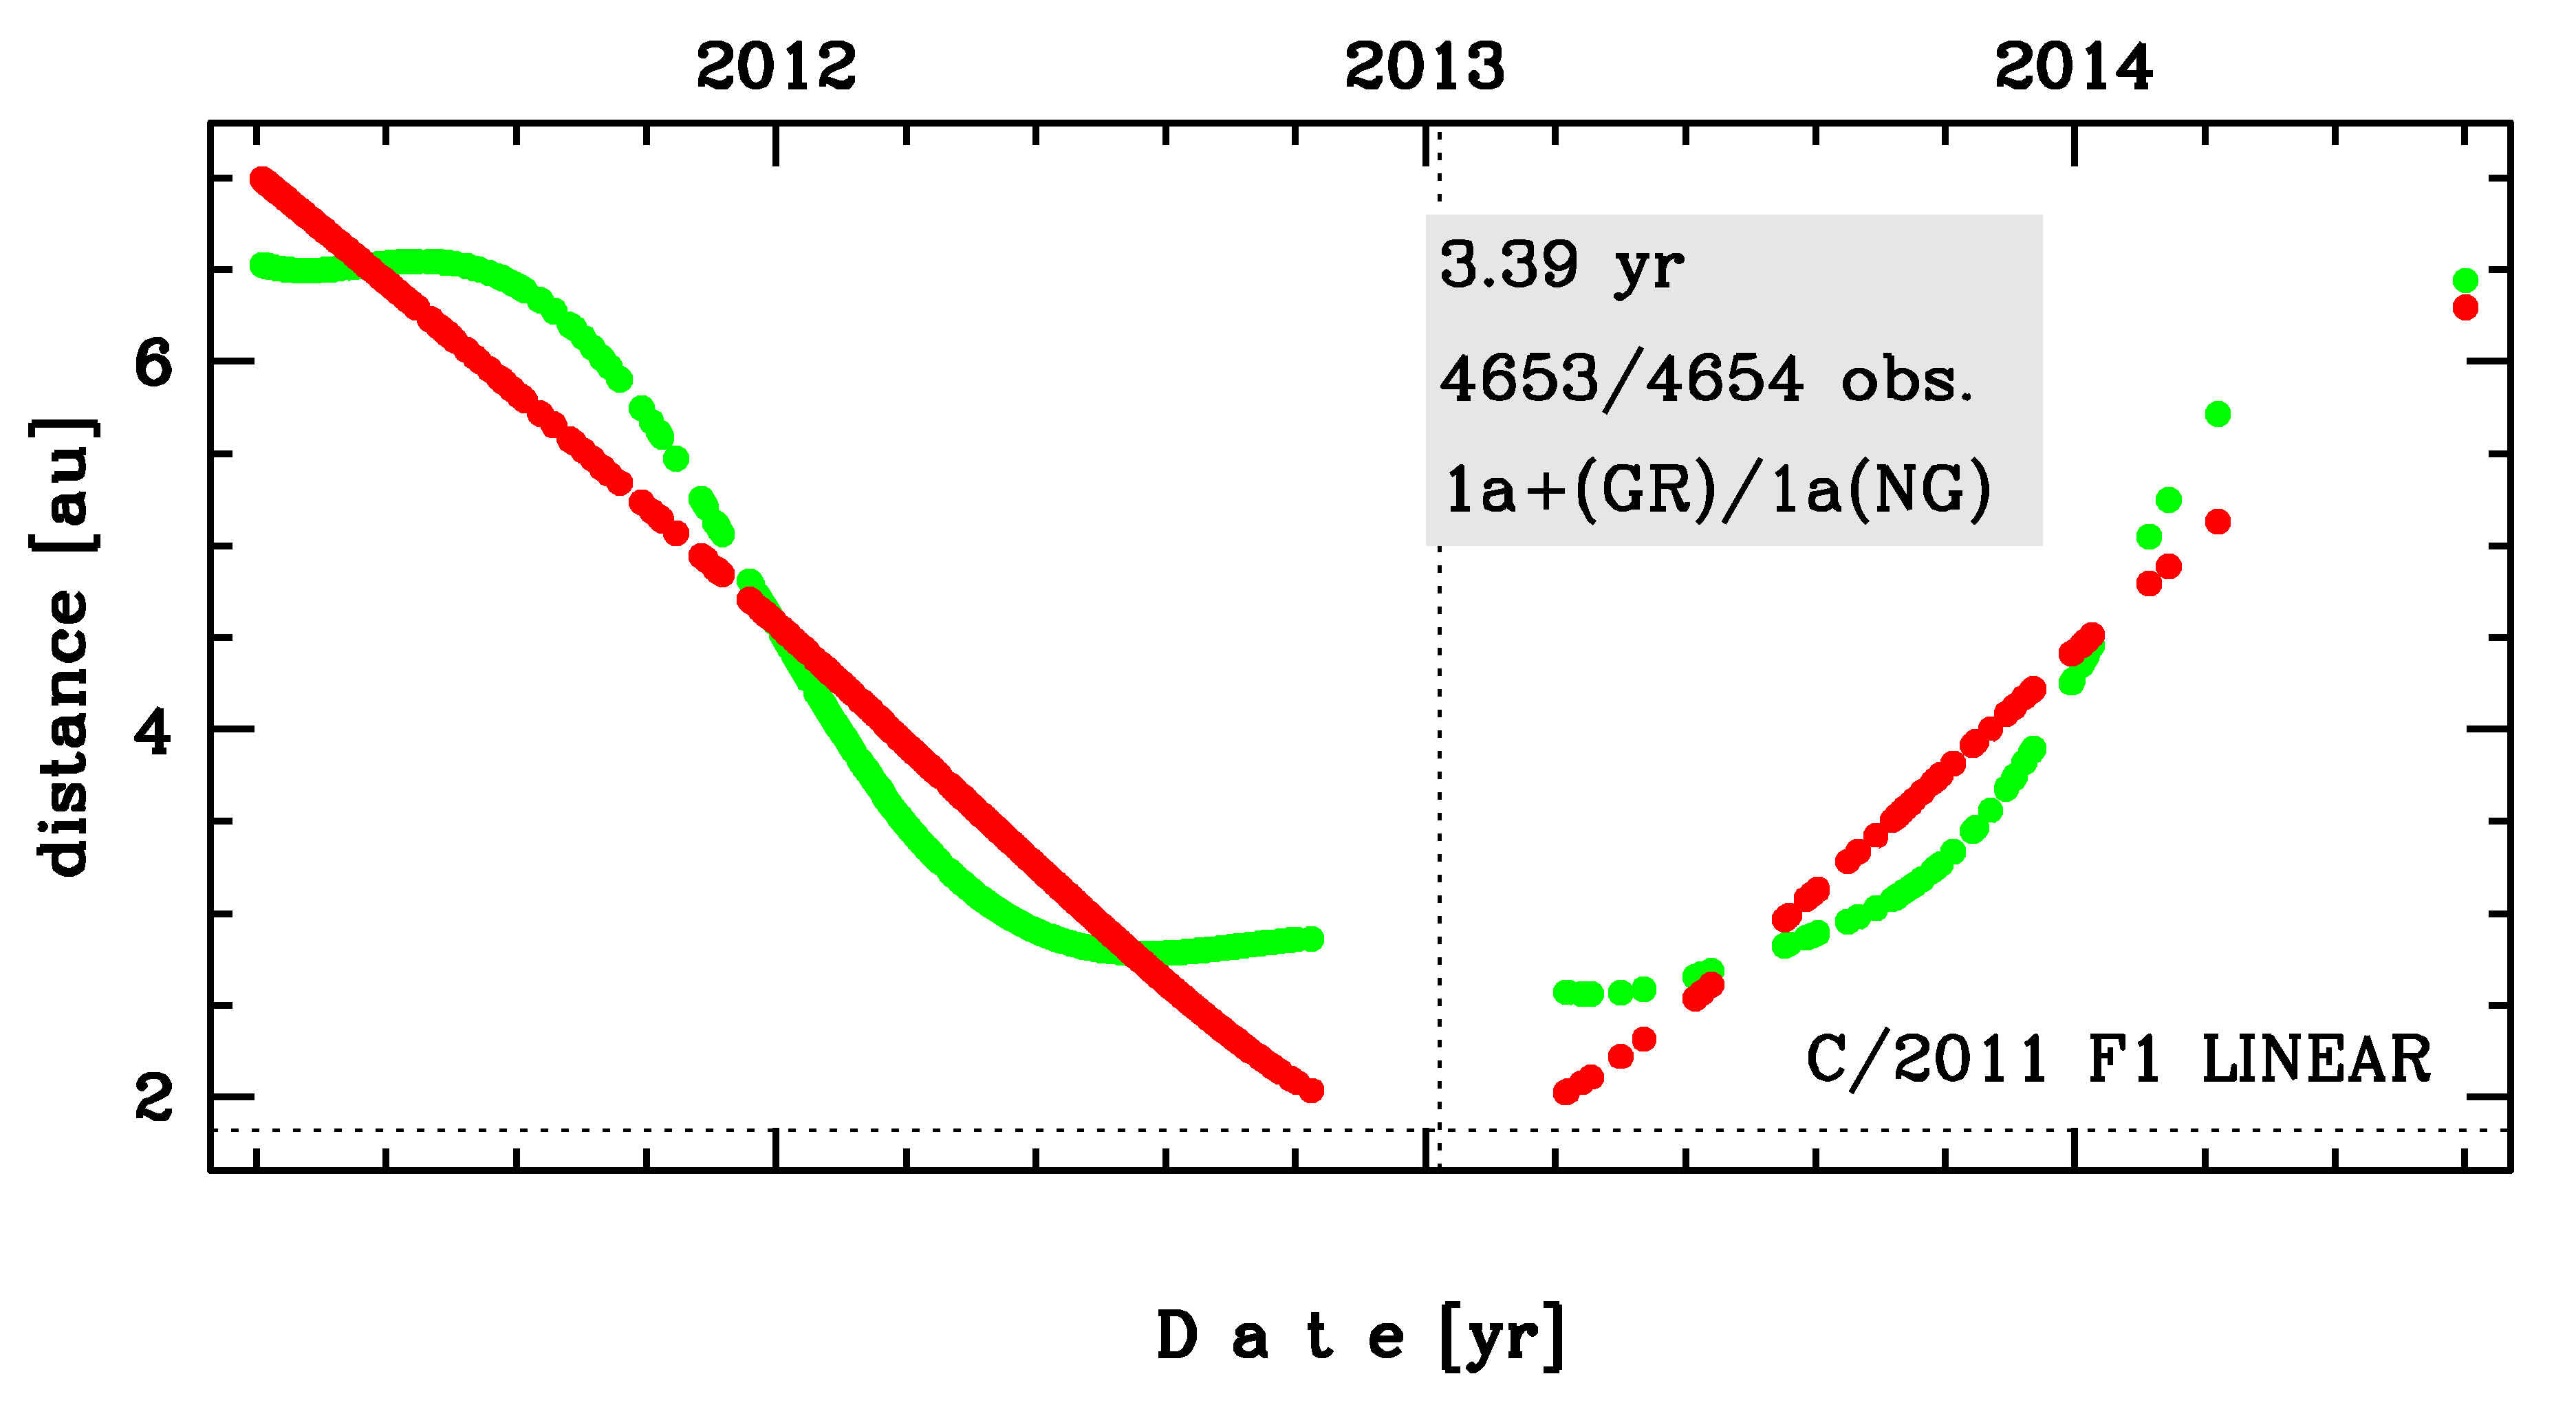
Time distribution of positional observations with corresponding heliocentric (red curve) and geocentric (green curve) distance at which they were taken. The horizontal dotted line shows the perihelion distance for a given comet whereas vertical dotted line — the moment of perihelion passage.
| next_g orbit statistics, here only the Galactic tide has been included | ||
|---|---|---|
| no. of returning VCs in the swarm | 5001 | * |
| no. of escaping VCs in the swarm | 0 | |
| no. of hyperbolas among escaping VCs in the swarm | 0 | |
| next reciprocal semi-major axis [10-6 au-1] | 322.20 – 326.35 – 330.40 | |
| next perihelion distance [au] | 1.81944 – 1.81947 – 1.81951 | |
| next aphelion distance [103 au] | 6.05 – 6.13 – 6.21 | |
| time interval to next perihelion [Myr] | 0.166 – 0.169 – 0.173 | |
| percentage of VCs with qnext < 10 | 100 | |