C/2011 M1 LINEAR
more info
Comet C/2011 M1 was discovered on 22 June 2011 during Lincoln Laboratory Near-Earth Asteroid Research project, that is 2.5 months before its perihelion passage. It was observed until 2 August 2011.
Comet had its closest approach to the Earth on 27 July 2011 (1.267 au), a bit more than a month after its discovery.
Solution given here is based on pre-perihelion data spanning over 0.112 yr in a range of heliocentric distances from 1.59 au to 1.10 au.
Original value of 1/a is negative; however within its uncertainty of about 3 sigma this comet can came from the Oort Cloud.
C/2011 M1 was observed only before peryhelion; future orbit is given here though it is not certin that this comet survived perihelion passage. See also Table 2 in Sekanina 2019.
See also Królikowska 2020.
| solution description | ||
|---|---|---|
| number of observations | 122 | |
| data interval | 2011 06 22 – 2011 08 02 | |
| data type | observed only before perihelion (PRE) | |
| data arc selection | entire data set (STD) | |
| range of heliocentric distances | 1.59 au – 1.1au | |
| detectability of NG effects in the comet's motion | NG effects not determinable | |
| type of model of motion | GR - gravitational orbit | |
| data weighting | YES | |
| number of residuals | 236 | |
| RMS [arcseconds] | 0.72 | |
| orbit quality class | 3a | |
| next orbit statistics, both Galactic and stellar perturbations were taken into account | ||
|---|---|---|
| no. of returning VCs in the swarm | 0 | |
| no. of escaping VCs in the swarm | 5001 | |
| no. of hyperbolas among escaping VCs in the swarm | 5001 | * |
| next reciprocal semi-major axis [10-6 au-1] | -3,405.68 – -2,771.61 – -2,116.19 | |
| next perihelion distance [au] | 0.7666 – 0.7689 – 0.7794 | |
| synchronous stop epoch [Myr] | 0.303 | S |
| percentage of VCs with qnext < 10 | 100 | |
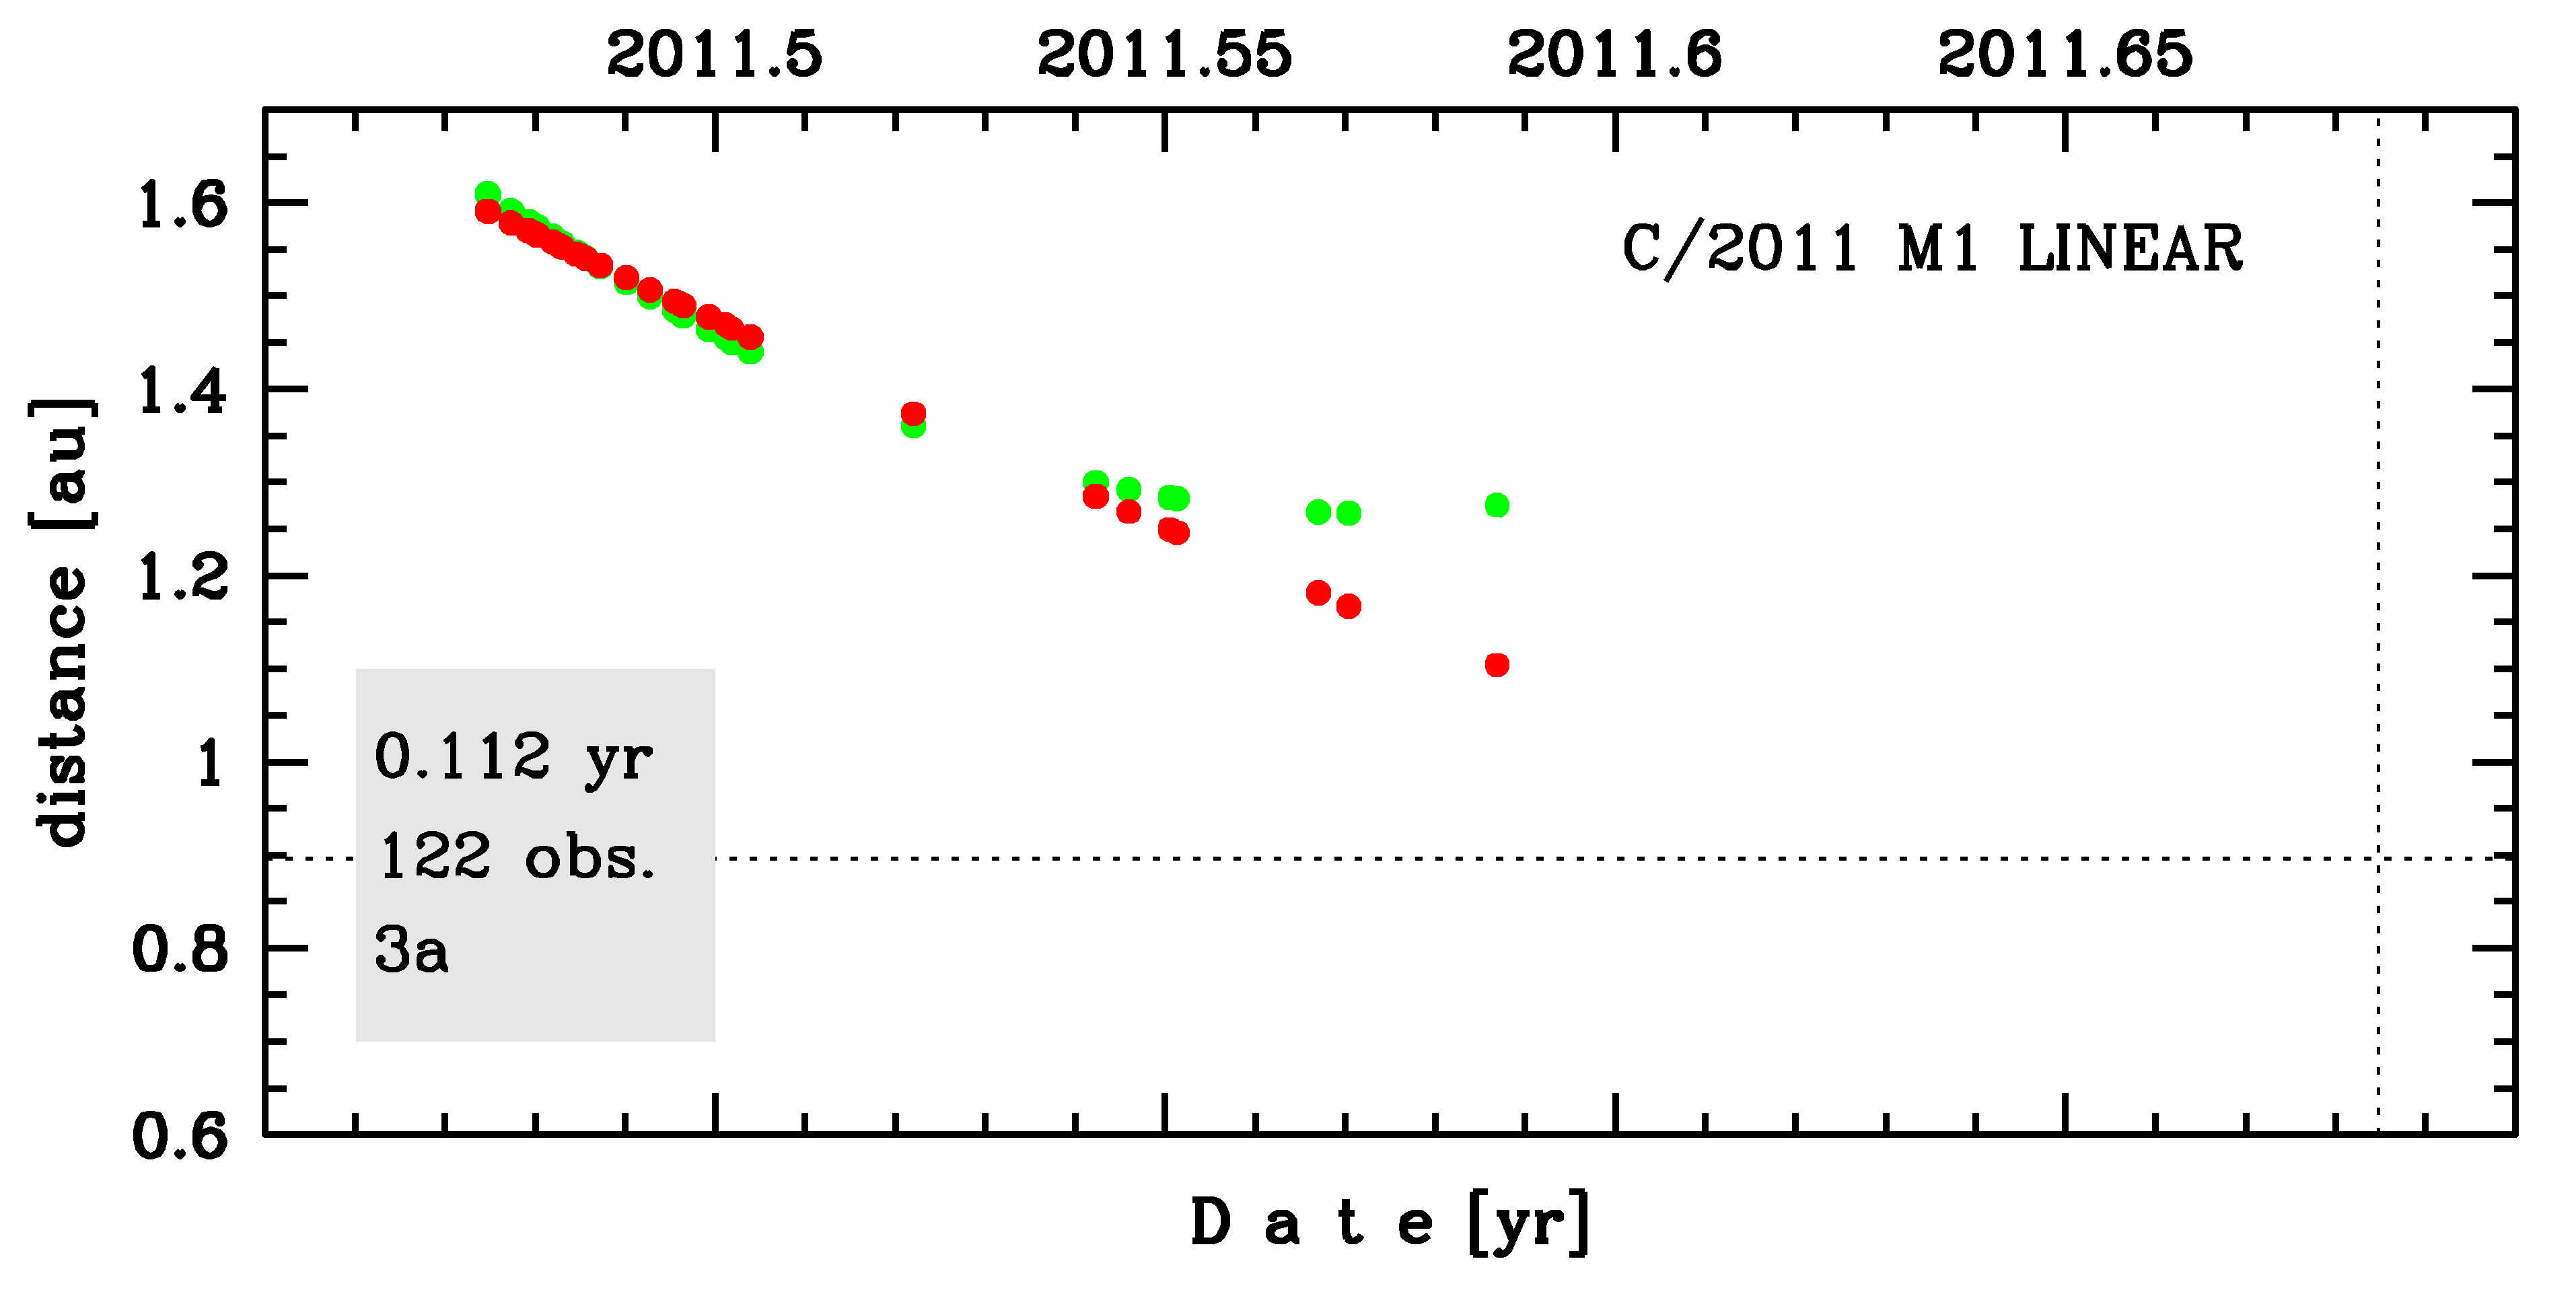
Time distribution of positional observations with corresponding heliocentric (red curve) and geocentric (green curve) distance at which they were taken. The horizontal dotted line shows the perihelion distance for a given comet whereas vertical dotted line — the moment of perihelion passage.
| next_g orbit statistics, here only the Galactic tide has been included | ||
|---|---|---|
| no. of returning VCs in the swarm | 0 | |
| no. of escaping VCs in the swarm | 5001 | |
| no. of hyperbolas among escaping VCs in the swarm | 5001 | * |
| next reciprocal semi-major axis [10-6 au-1] | -3,406.00 – -2,771.86 – -2,116.38 | |
| next perihelion distance [au] | 0.7562 – 0.7609 – 0.7745 | |
| synchronous stop epoch [Myr] | 0.294 | S |
| percentage of VCs with qnext < 10 | 100 | |