C/2011 Q1 PANSTARRS
more info
Comet C/2011 Q1 was discovered on 20 August 2011 by Pan-STARRS 1 telescope (Haleakala), that is about 1.5 month after its perihelion passage. Soon, C/2011 Q1 was found on earlier images taken on 17 August 2011 with the Pan-STARRS 1 survey. It was occasionally observed less than a year.
Comet had its closest approach to the Earth on 21 August 2011 (6.046 au), a day after its discovery.
Solution given here is based on data spanning over 0.86 yr in a range of heliocentric distances from 6.79 au to 7.18 au.
This comet have orignal semimajor axis shorter than 10000 au; it suffers a tiny planetary perturbations during its passage through the planetary system that lead to a more tight future orbit. (see future barycentric orbit).
| solution description | ||
|---|---|---|
| number of observations | 59 | |
| data interval | 2011 08 17 – 2012 06 25 | |
| data type | observed only after perihelion (POST) | |
| data arc selection | entire data set (STD) | |
| range of heliocentric distances | 6.79 au – 7.18au | |
| detectability of NG effects in the comet's motion | NG effects not determinable | |
| type of model of motion | GR - gravitational orbit | |
| data weighting | YES | |
| number of residuals | 106 | |
| RMS [arcseconds] | 0.29 | |
| orbit quality class | 1b | |
| previous orbit statistics, both Galactic and stellar perturbations were taken into account | ||
|---|---|---|
| no. of returning VCs in the swarm | 5001 | * |
| no. of escaping VCs in the swarm | 0 | |
| no. of hyperbolas among escaping VCs in the swarm | 0 | |
| previous reciprocal semi-major axis [10-6 au-1] | 361.24 – 366.89 – 372.38 | |
| previous perihelion distance [au] | 6.7804 – 6.78048 – 6.78056 | |
| previous aphelion distance [103 au] | 5.36 – 5.44 – 5.53 | |
| time interval to previous perihelion [Myr] | 0.139 – 0.142 – 0.145 | |
| percentage of VCs with qprev < 10 | 100 | |
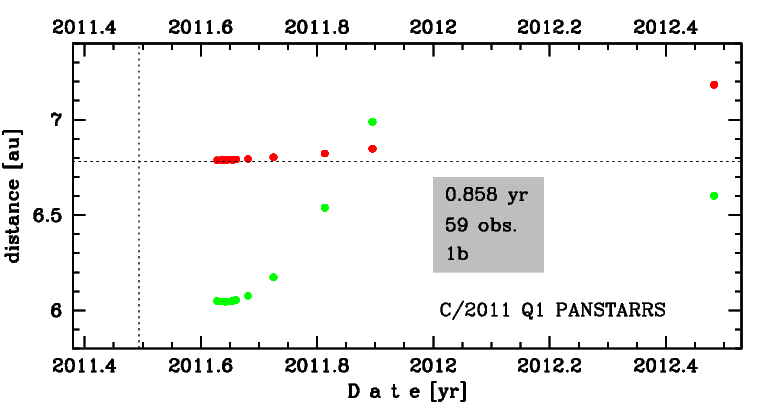
Time distribution of positional observations with corresponding heliocentric (red curve) and geocentric (green curve) distance at which they were taken. The horizontal dotted line shows the perihelion distance for a given comet whereas vertical dotted line — the moment of perihelion passage.
| previous_g orbit statistics, here only the Galactic tide has been included | ||
|---|---|---|
| no. of returning VCs in the swarm | 5001 | * |
| no. of escaping VCs in the swarm | 0 | |
| no. of hyperbolas among escaping VCs in the swarm | 0 | |
| previous reciprocal semi-major axis [10-6 au-1] | 361.24 – 366.89 – 372.38 | |
| previous perihelion distance [au] | 6.7798 – 6.77986 – 6.77992 | |
| previous aphelion distance [103 au] | 5.36 – 5.44 – 5.53 | |
| time interval to previous perihelion [Myr] | 0.139 – 0.142 – 0.145 | |
| percentage of VCs with qprev < 10 | 100 | |