C/2011 R1 McNaught
more info
Comet C/2011 R1 was discovered on 3 September 2011 by Robert H. McNaught (Siding Spring), that is more than a year before its perihelion passage. It was observed until 11 April 2014.
Comet had its closest approach to the Earth on 8 April 2013 (1.960 au), 5.5 months after its perihelion passage; however on 8 August 2012 (2.5 months before perihelion) the comet approached the Earth only a little further (2.035 au, see picture).
Solution given here is based on data spanning over 3.5 yr in a range of heliocentric distances: 7.47 au – 2.08 au (perihelion) – 5.91 au.
This Oort spike comet suffers tiny planetary perturbations during its passage through the planetary system that cause a bit tighter future orbit with original semimajor axis of about 10,000 au (see future barycentric orbits).
See also Królikowska 2020.
| solution description | ||
|---|---|---|
| number of observations | 1504 | |
| data interval | 2010 10 11 – 2014 04 11 | |
| data type | perihelion within the observation arc (FULL) | |
| data arc selection | entire data set (STD) | |
| range of heliocentric distances | 7.47 au – 2.08 au (perihelion) – 5.91 au | |
| type of model of motion | NT - non-gravitational orbits for asymmetric, standard g(r) | |
| data weighting | YES | |
| number of residuals | 2909 | |
| RMS [arcseconds] | 0.37 | |
| orbit quality class | 1a+ | |
| orbital elements (barycentric ecliptic J2000) | ||
|---|---|---|
| Epoch | 2314 01 11 | |
| perihelion date | 2012 10 20.08816468 | ± 0.00034842 |
| perihelion distance [au] | 2.08026504 | ± 0.00000240 |
| eccentricity | 0.99979079 | ± 0.00000423 |
| argument of perihelion [°] | 308.860242 | ± 0.000118 |
| ascending node [°] | 221.464480 | ± 0.000009 |
| inclination [°] | 116.181969 | ± 0.000025 |
| reciprocal semi-major axis [10-6 au-1] | 100.57 | ± 2.03 |
| file containing 5001 VCs swarm |
|---|
| 2011r1n6.bpl |
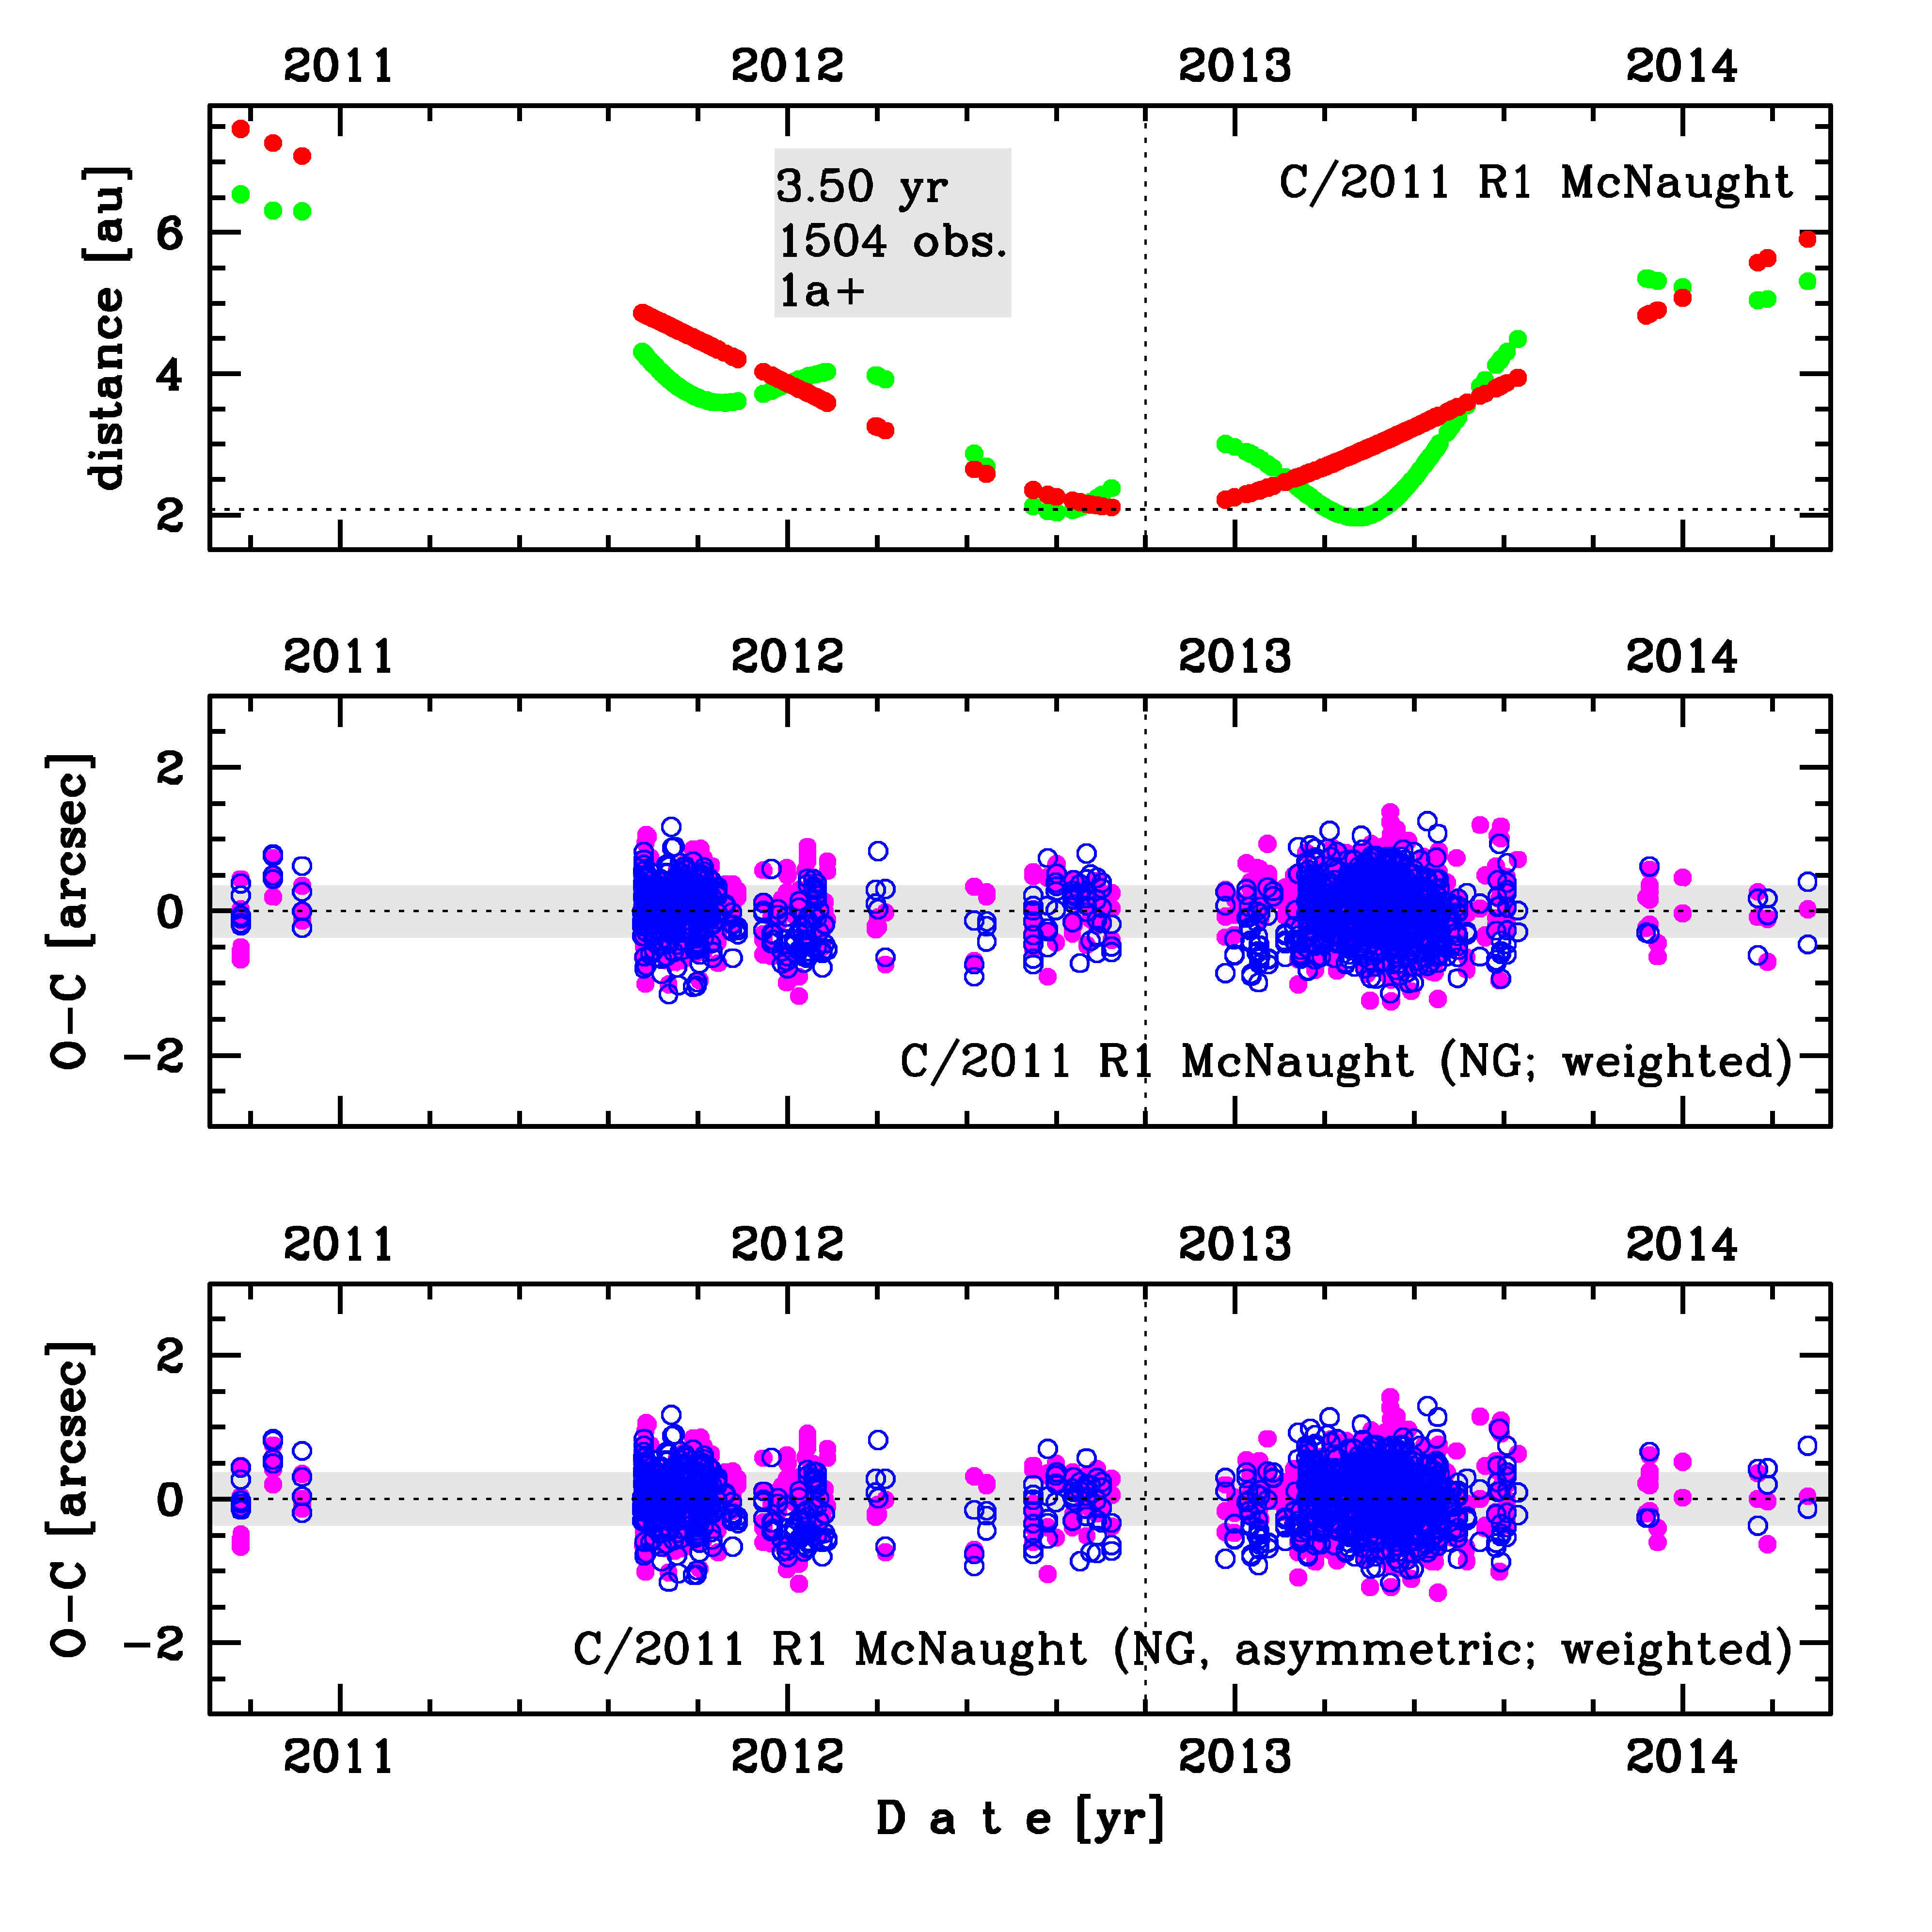
Upper panel: Time distribution of positional observations with corresponding heliocentric (red curve) and geocentric (green curve) distance at which they were taken. The horizontal dotted line shows the perihelion distance for a given comet whereas vertical dotted line — the moment of perihelion passage.
Lower panel (panels): O-C diagram for this(two) solution (solutions) given in this database, where residuals in right ascension are shown using magenta dots and in declination by blue open circles.
Lower panel (panels): O-C diagram for this(two) solution (solutions) given in this database, where residuals in right ascension are shown using magenta dots and in declination by blue open circles.
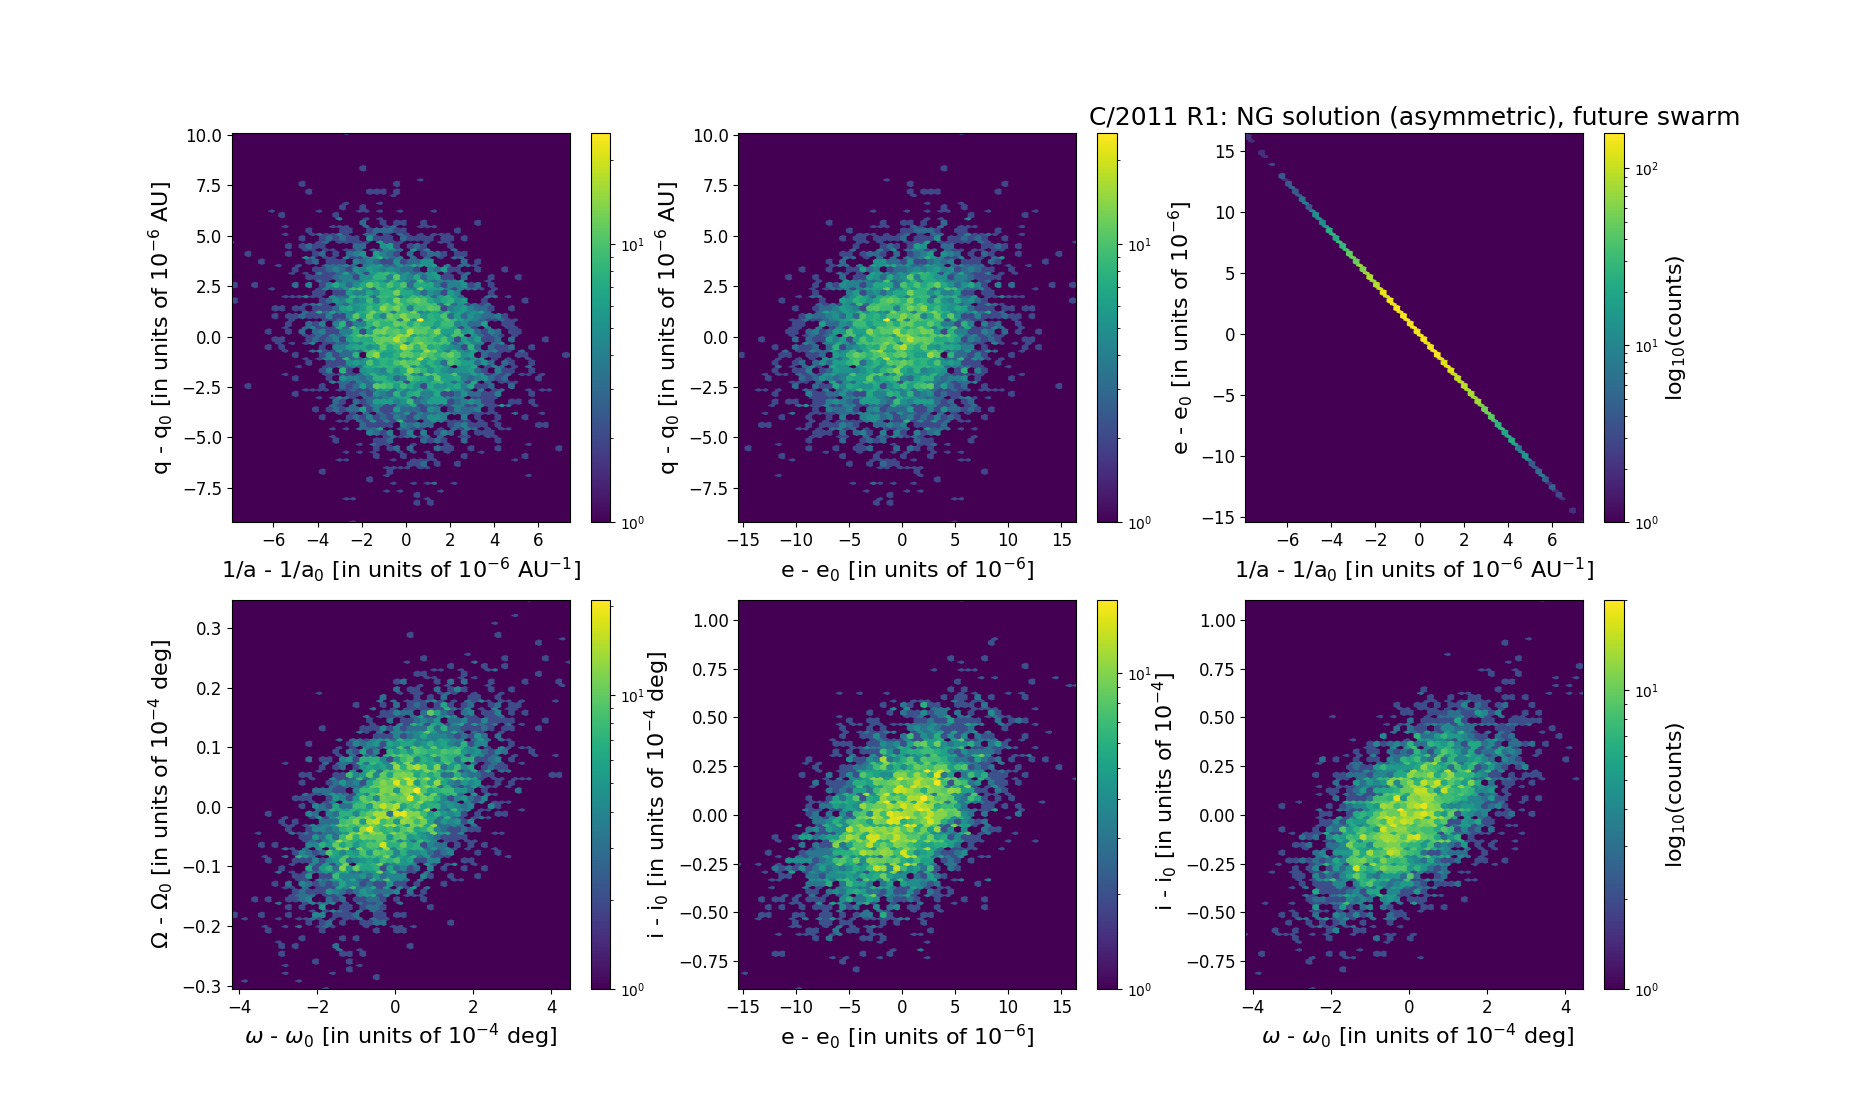
Six 2D-projections of the 6D space of future swarm including 5001 VCs. Each density map is given in logarithmic scale presented on the right in the individual panel.