C/2012 CH17 MOSS
more info
Comet C/2012 CH17 was discovered on 7 February 2012 with Morocco Oukaimeden Sky Survey (MOSS), that is almost 7.5 months before its perihelion passage. Next, a few prediscovery images taken on 2 February 2012 with Catalina Sky Survey were found. After perihelion passage, it was observed only on 10 June 2013.
Comet had its closest approach to the Earth on 24 September 2012 (1.737 au), 4 days before its perihelion passage.
Solution given here is based on data spanning over 1.35 yr in a range of heliocentric distances: 3.41 au – 1.296 au (perihelion) – 3.58 au.
According to preferred solution, this Oort spike comet suffers tiny planetary perturbations during its passage through the planetary system (see original and future barycentric orbits).
See also Królikowska 2020.
| solution description | ||
|---|---|---|
| number of observations | 653 | |
| data interval | 2012 02 02 – 2013 06 10 | |
| data type | significantly more measurements before perihelion (PRE+) | |
| data arc selection | entire data set (STD) | |
| range of heliocentric distances | 3.41 au – 1.30 au (perihelion) – 3.58 au | |
| type of model of motion | NS - non-gravitational orbits for standard g(r) | |
| data weighting | YES | |
| number of residuals | 1291 | |
| RMS [arcseconds] | 0.55 | |
| orbit quality class | 1b | |
| orbital elements (barycentric ecliptic J2000) | ||
|---|---|---|
| Epoch | 2312 01 22 | |
| perihelion date | 2012 09 28.43624280 | ± 0.00343501 |
| perihelion distance [au] | 1.29620879 | ± 0.00002841 |
| eccentricity | 0.99992533 | ± 0.00011581 |
| argument of perihelion [°] | 138.070680 | ± 0.003549 |
| ascending node [°] | 125.853942 | ± 0.000460 |
| inclination [°] | 27.750482 | ± 0.000212 |
| reciprocal semi-major axis [10-6 au-1] | 57.61 | ± 89.35 |
| file containing 5001 VCs swarm |
|---|
| 2012chn4.bpl |
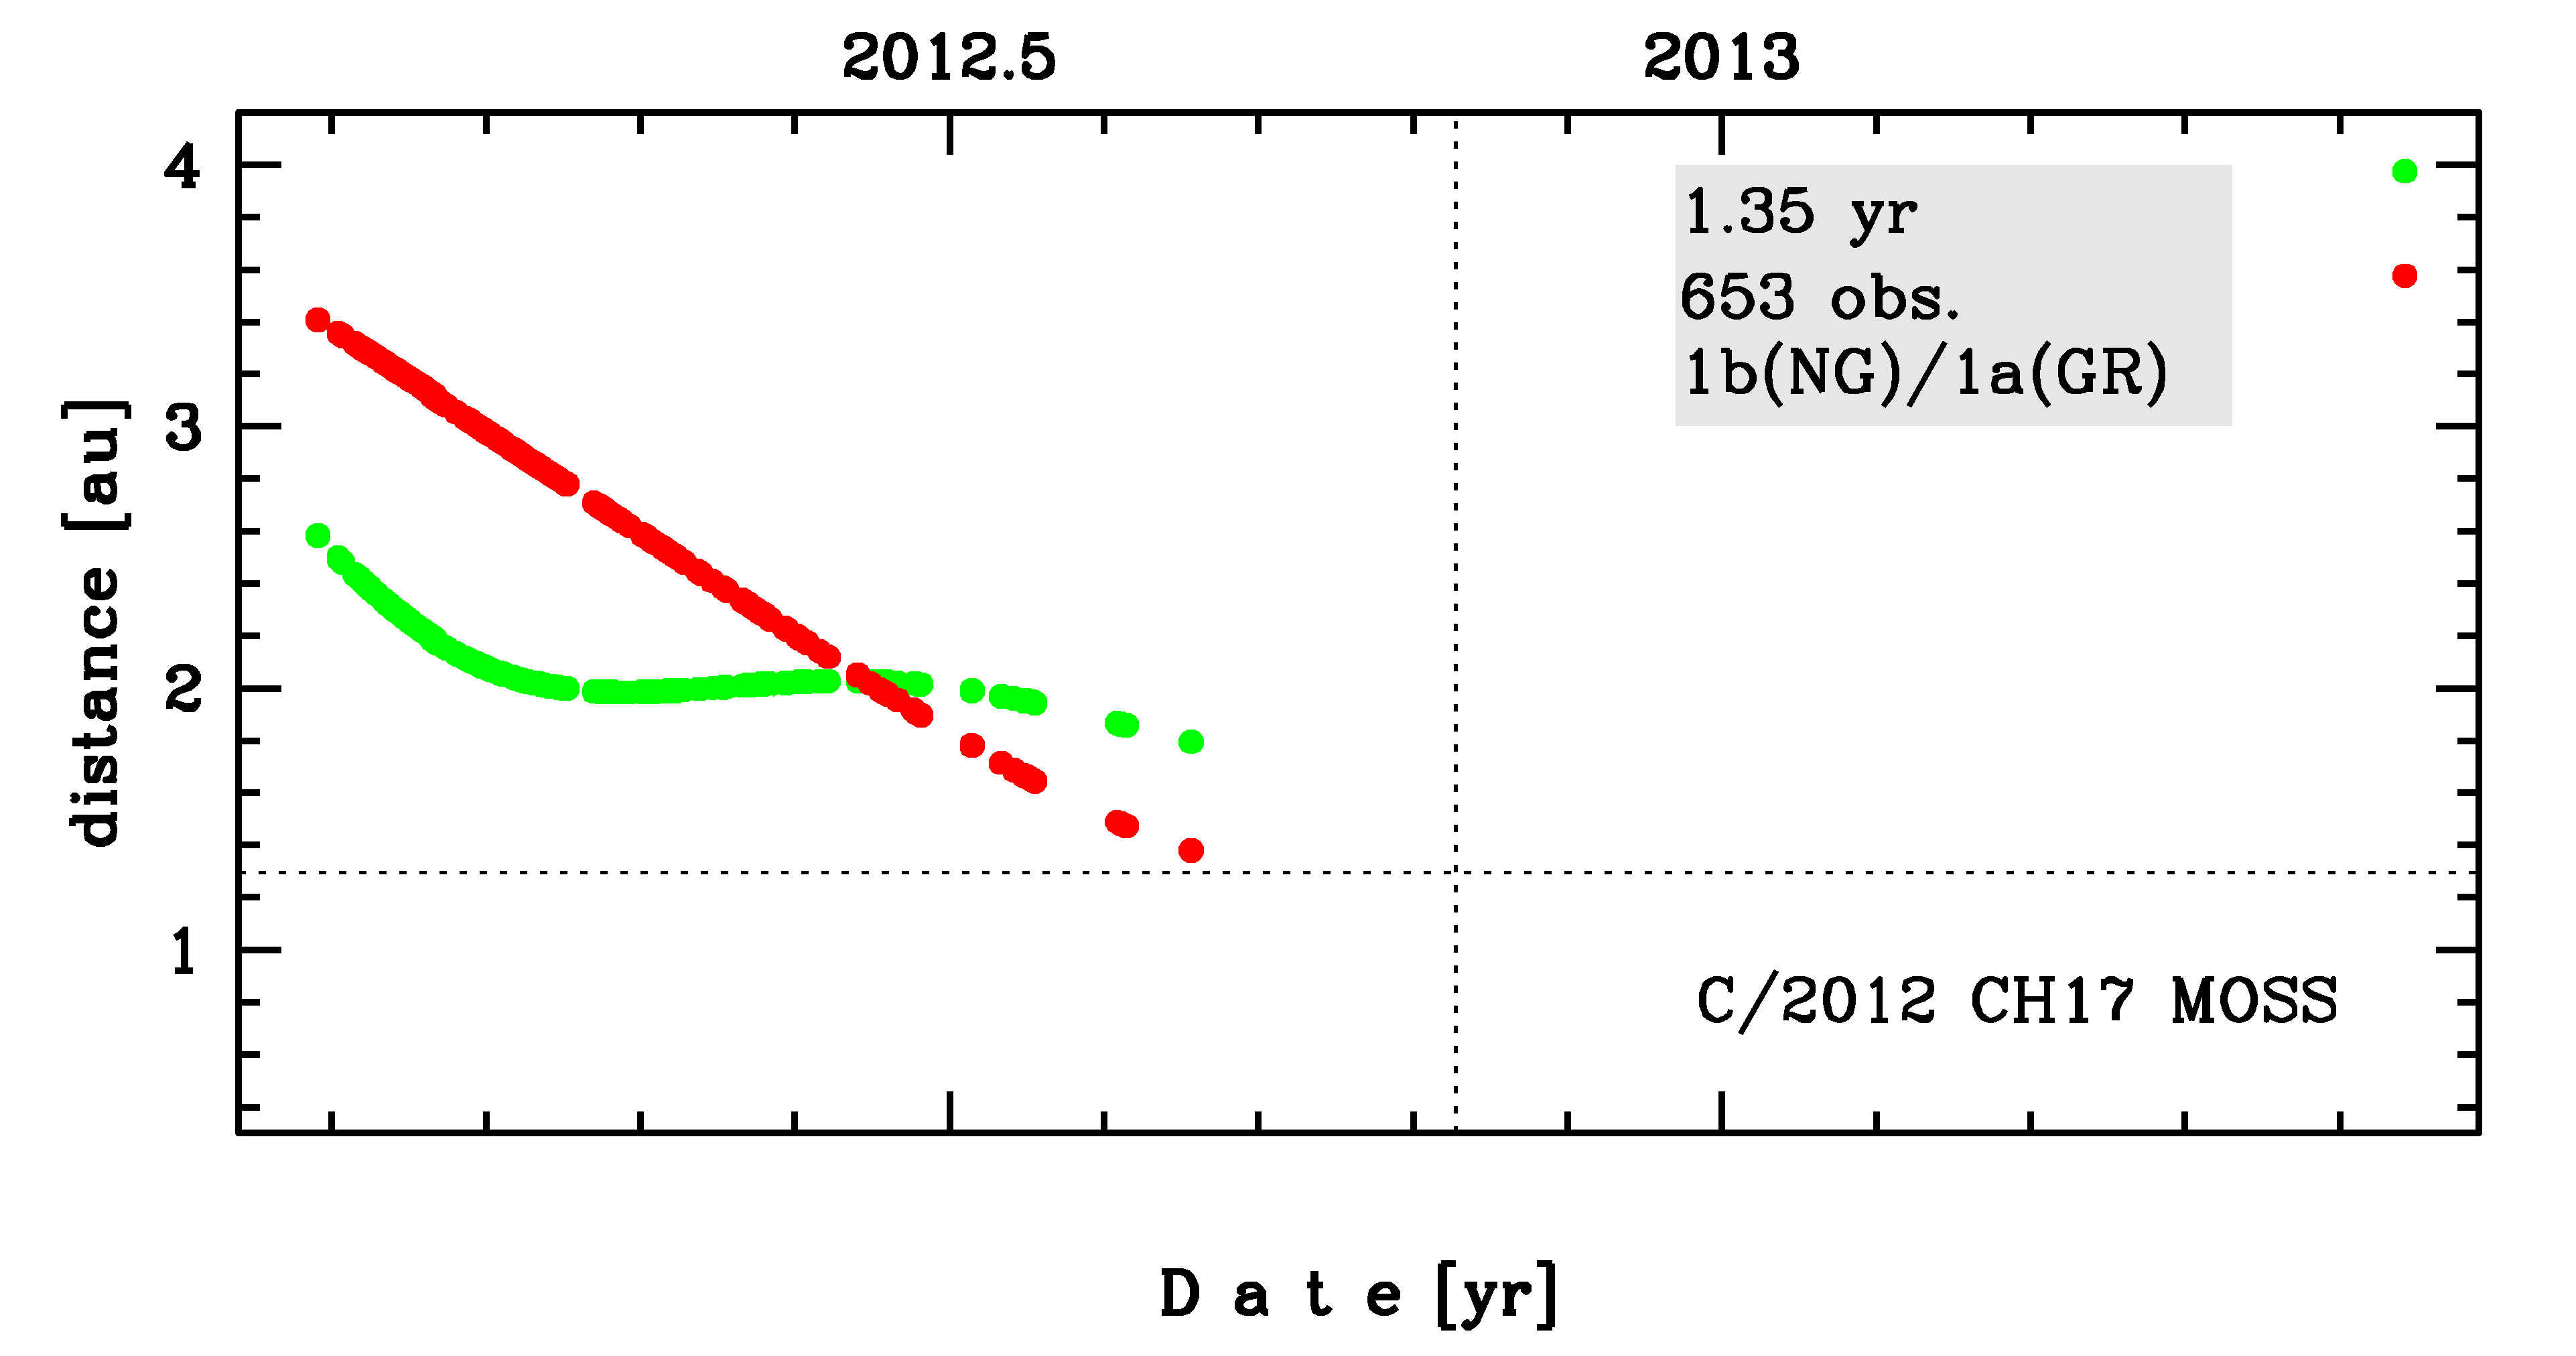
Time distribution of positional observations with corresponding heliocentric (red curve) and geocentric (green curve) distance at which they were taken. The horizontal dotted line shows the perihelion distance for a given comet whereas vertical dotted line — the moment of perihelion passage.
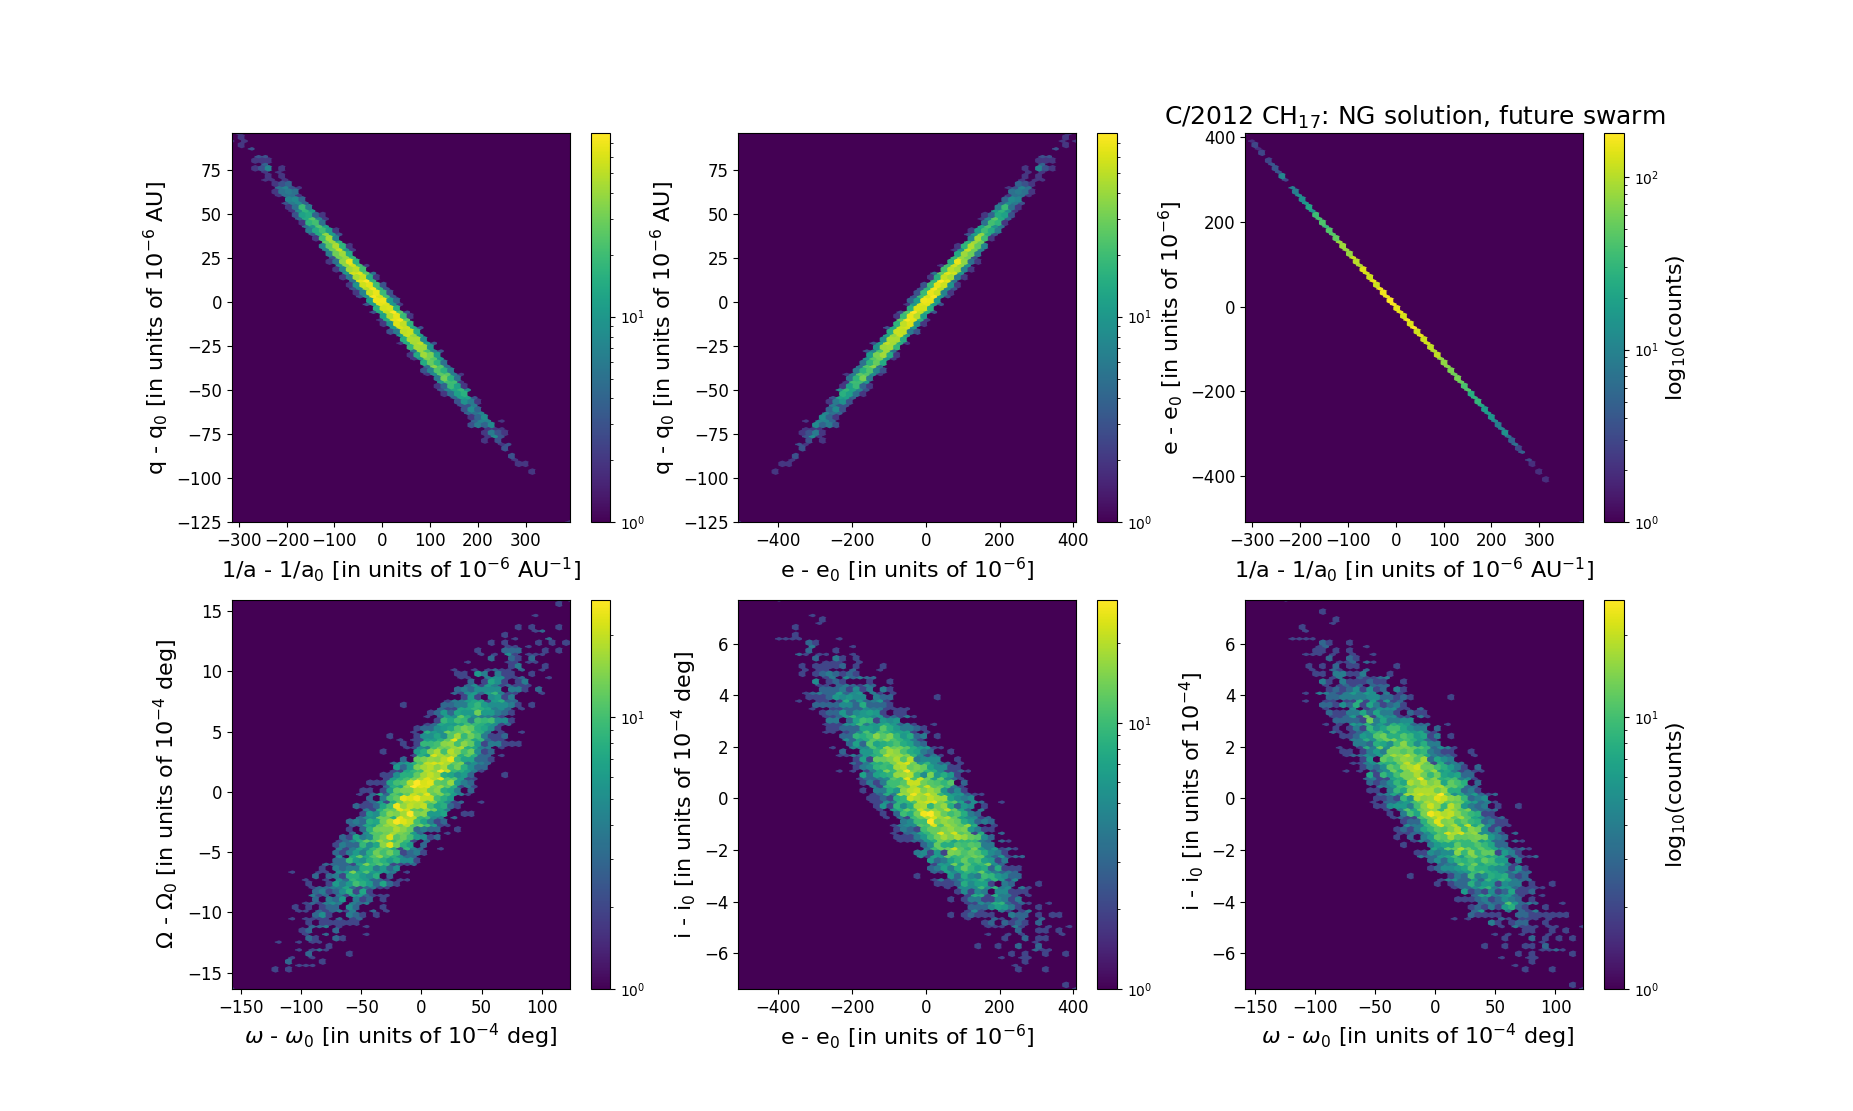
Six 2D-projections of the 6D space of future swarm including 5001 VCs. Each density map is given in logarithmic scale presented on the right in the individual panel.