C/2012 LP26 Palomar
more info
Comet C/2012 LP26 was discovered on 10 June 2012 with Palomar Transient Factory survey, that is about 3.2 years before its perihelion passage. Soon, it was found on earlier images taken on 23 May 2012 with the Mount Lemmon Survey. It was observed until 5 October 2018.
Comet had its closest approach to the Earth in June 2013 (7.5 au), about a year after its discovery.
Solutions given here are based on data spanning over 6.37 yr in a range of heliocentric distances: 10.02 au – 6.536 au (perihelion) – 9.86 au (5 October 2018).
NG orbit is possible to obtained using the full data arc; however uncertainties of NG parameters are notable, especially for A2 (see solutions ac and bc differing only in data weighting).
This Oort spike comet suffers small planetary perturbations during its passage through the planetary system; however, these perturbations lead to escape the comet from the planetary zone on a hyperbolic orbit (see future barycentric orbit).
See also Królikowska and Dones 2023.
| solution description | ||
|---|---|---|
| number of observations | 442 | |
| data interval | 2012 05 23 – 2018 10 05 | |
| data type | perihelion within the observation arc (FULL) | |
| data arc selection | entire data set (STD) | |
| range of heliocentric distances | 10.01 au – 6.54 au (perihelion) – 9.86 au | |
| detectability of NG effects in the comet's motion | comet with determinable NG~orbit | |
| type of model of motion | GR - gravitational orbit | |
| data weighting | YES | |
| number of residuals | 862 | |
| RMS [arcseconds] | 0.48 | |
| orbit quality class | 1a+ | |
| orbital elements (barycentric ecliptic J2000) | ||
|---|---|---|
| Epoch | 2322 03 30 | |
| perihelion date | 2015 08 17.33311060 | ± 0.00040858 |
| perihelion distance [au] | 6.53675761 | ± 0.00000257 |
| eccentricity | 1.00065198 | ± 0.00000330 |
| argument of perihelion [°] | 145.192830 | ± 0.000033 |
| ascending node [°] | 153.984733 | ± 0.000018 |
| inclination [°] | 25.360083 | ± 0.000009 |
| reciprocal semi-major axis [10-6 au-1] | -99.74 | ± 0.50 |
| file containing 5001 VCs swarm |
|---|
| 2012lpba.bpl |

Upper panel: Time distribution of positional observations with corresponding heliocentric (red curve) and geocentric (green curve) distance at which they were taken. The horizontal dotted line shows the perihelion distance for a given comet whereas vertical dotted line — the moment of perihelion passage.
Middle panel(s): O-C diagram for a given solution (sometimes in comparison to another solution available in CODE), where residuals in right ascension are shown using magenta dots and in declination by blue open circles.
Lowest panel: Relative weights for a given data set(s).
Middle panel(s): O-C diagram for a given solution (sometimes in comparison to another solution available in CODE), where residuals in right ascension are shown using magenta dots and in declination by blue open circles.
Lowest panel: Relative weights for a given data set(s).
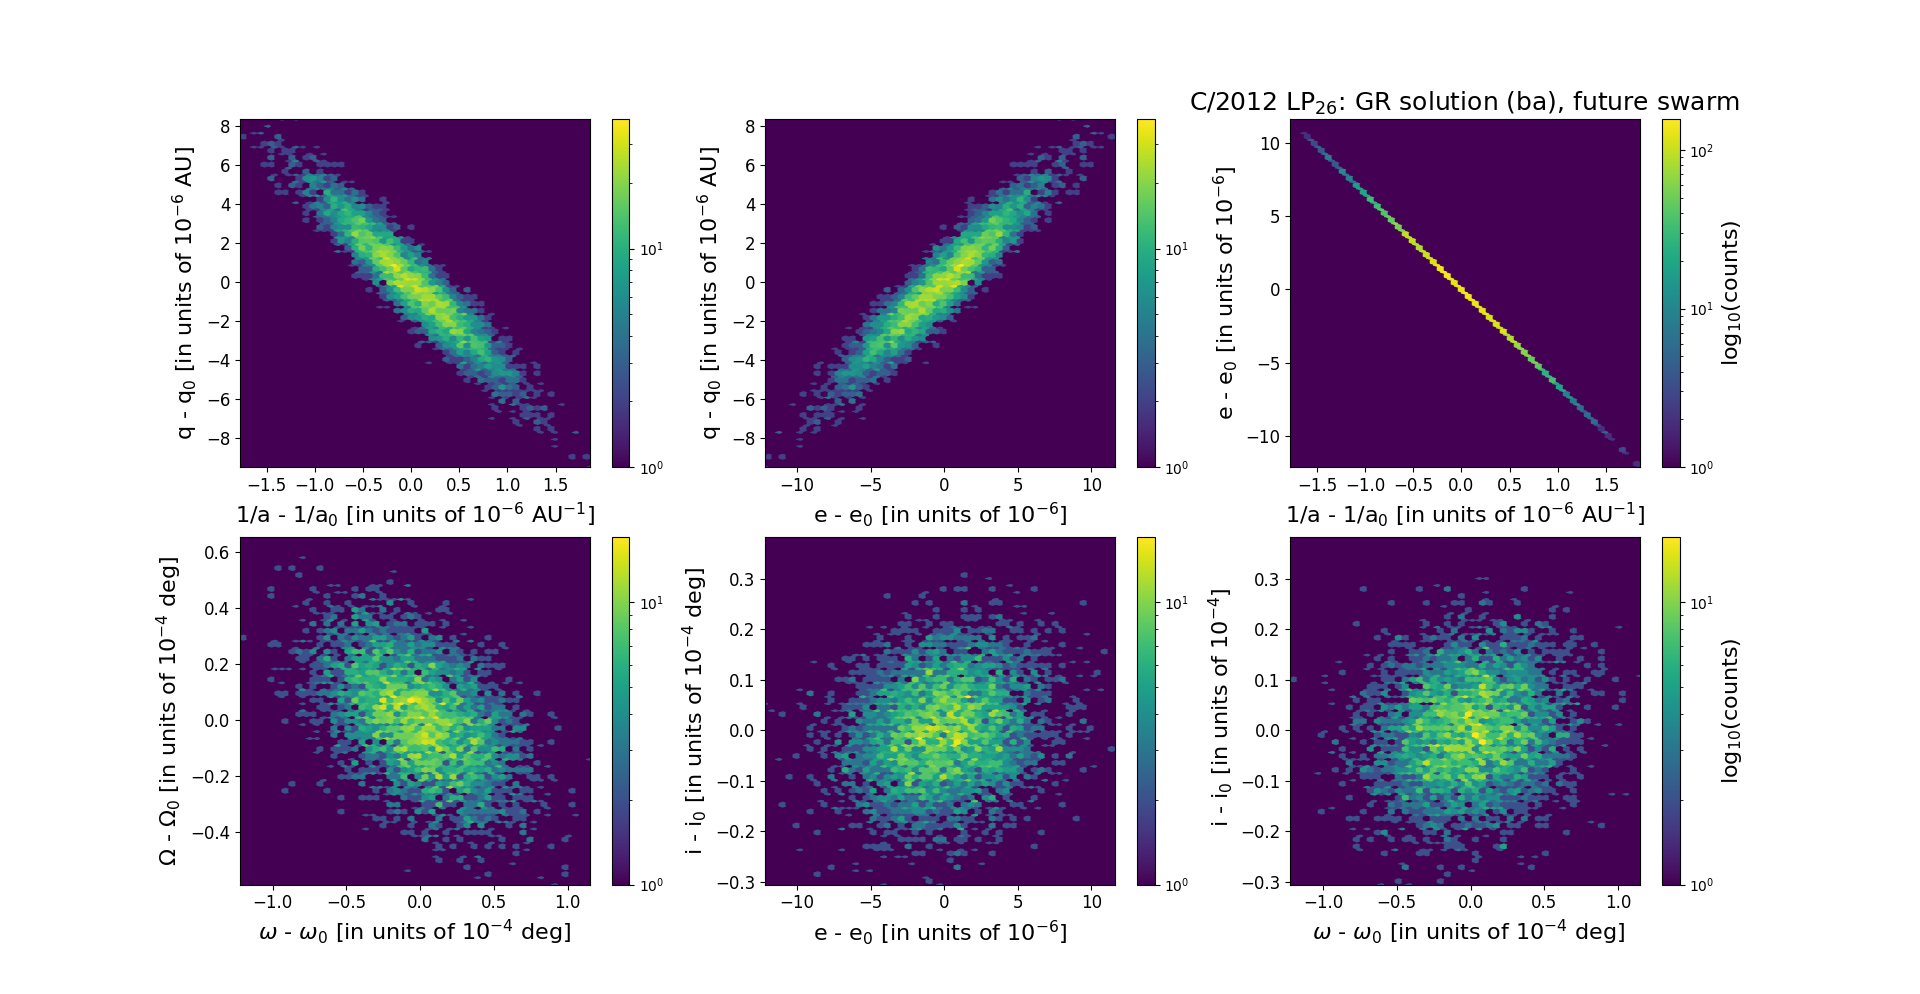
Six 2D-projections of the 6D space of future swarm including 5001 VCs. Each density map is given in logarithmic scale presented on the right in the individual panel.