C/2012 V1 PANSTARRS
more info
Comet C/2012 V1 was discovered on 3 November 2012 with Pan-STARRS 1 telescope (Haleakala), that is almost 9 months before its perihelion passage. It was observed until 13 August 2013 (see picture).
C/2012 V1 had its closest approach to the Earth on 5 August 2013 (1.163 au), about 2 weeks after its perihelion passage.
Solution given here is based on data spanning over 0.775 yr in a range of heliocentric distances: 3.58 au – 2.09 au (perihelion) – 2.11 au.
This probably Oort spike comet (slightly negative original 1/a) suffers moderate planetary perturbations during its passage through the planetary system that cause a tighter future orbit with a semimajor axis of about 1,300 au (see future barycentric orbits).
See also Królikowska 2020.
| solution description | ||
|---|---|---|
| number of observations | 97 | |
| data interval | 2012 11 03 – 2013 08 13 | |
| data type | significantly more measurements before perihelion (PRE+) | |
| data arc selection | entire data set (STD) | |
| range of heliocentric distances | 3.58 au – 2.09 au (perihelion) – 2.11 au | |
| detectability of NG effects in the comet's motion | NG effects not determinable | |
| type of model of motion | GR - gravitational orbit | |
| data weighting | YES | |
| number of residuals | 177 | |
| RMS [arcseconds] | 0.36 | |
| orbit quality class | 1b | |
| next orbit statistics, both Galactic and stellar perturbations were taken into account | ||
|---|---|---|
| no. of returning VCs in the swarm | 5001 | * |
| no. of escaping VCs in the swarm | 0 | |
| no. of hyperbolas among escaping VCs in the swarm | 0 | |
| next reciprocal semi-major axis [10-6 au-1] | 784.93 – 787.89 – 790.85 | |
| next perihelion distance [au] | 2.08902 – 2.08904 – 2.08906 | |
| next aphelion distance [103 au] | 2.527 – 2.536 – 2.546 | |
| time interval to next perihelion [Myr] | 0.04466 – 0.0449 – 0.04515 | |
| percentage of VCs with qnext < 10 | 100 | |
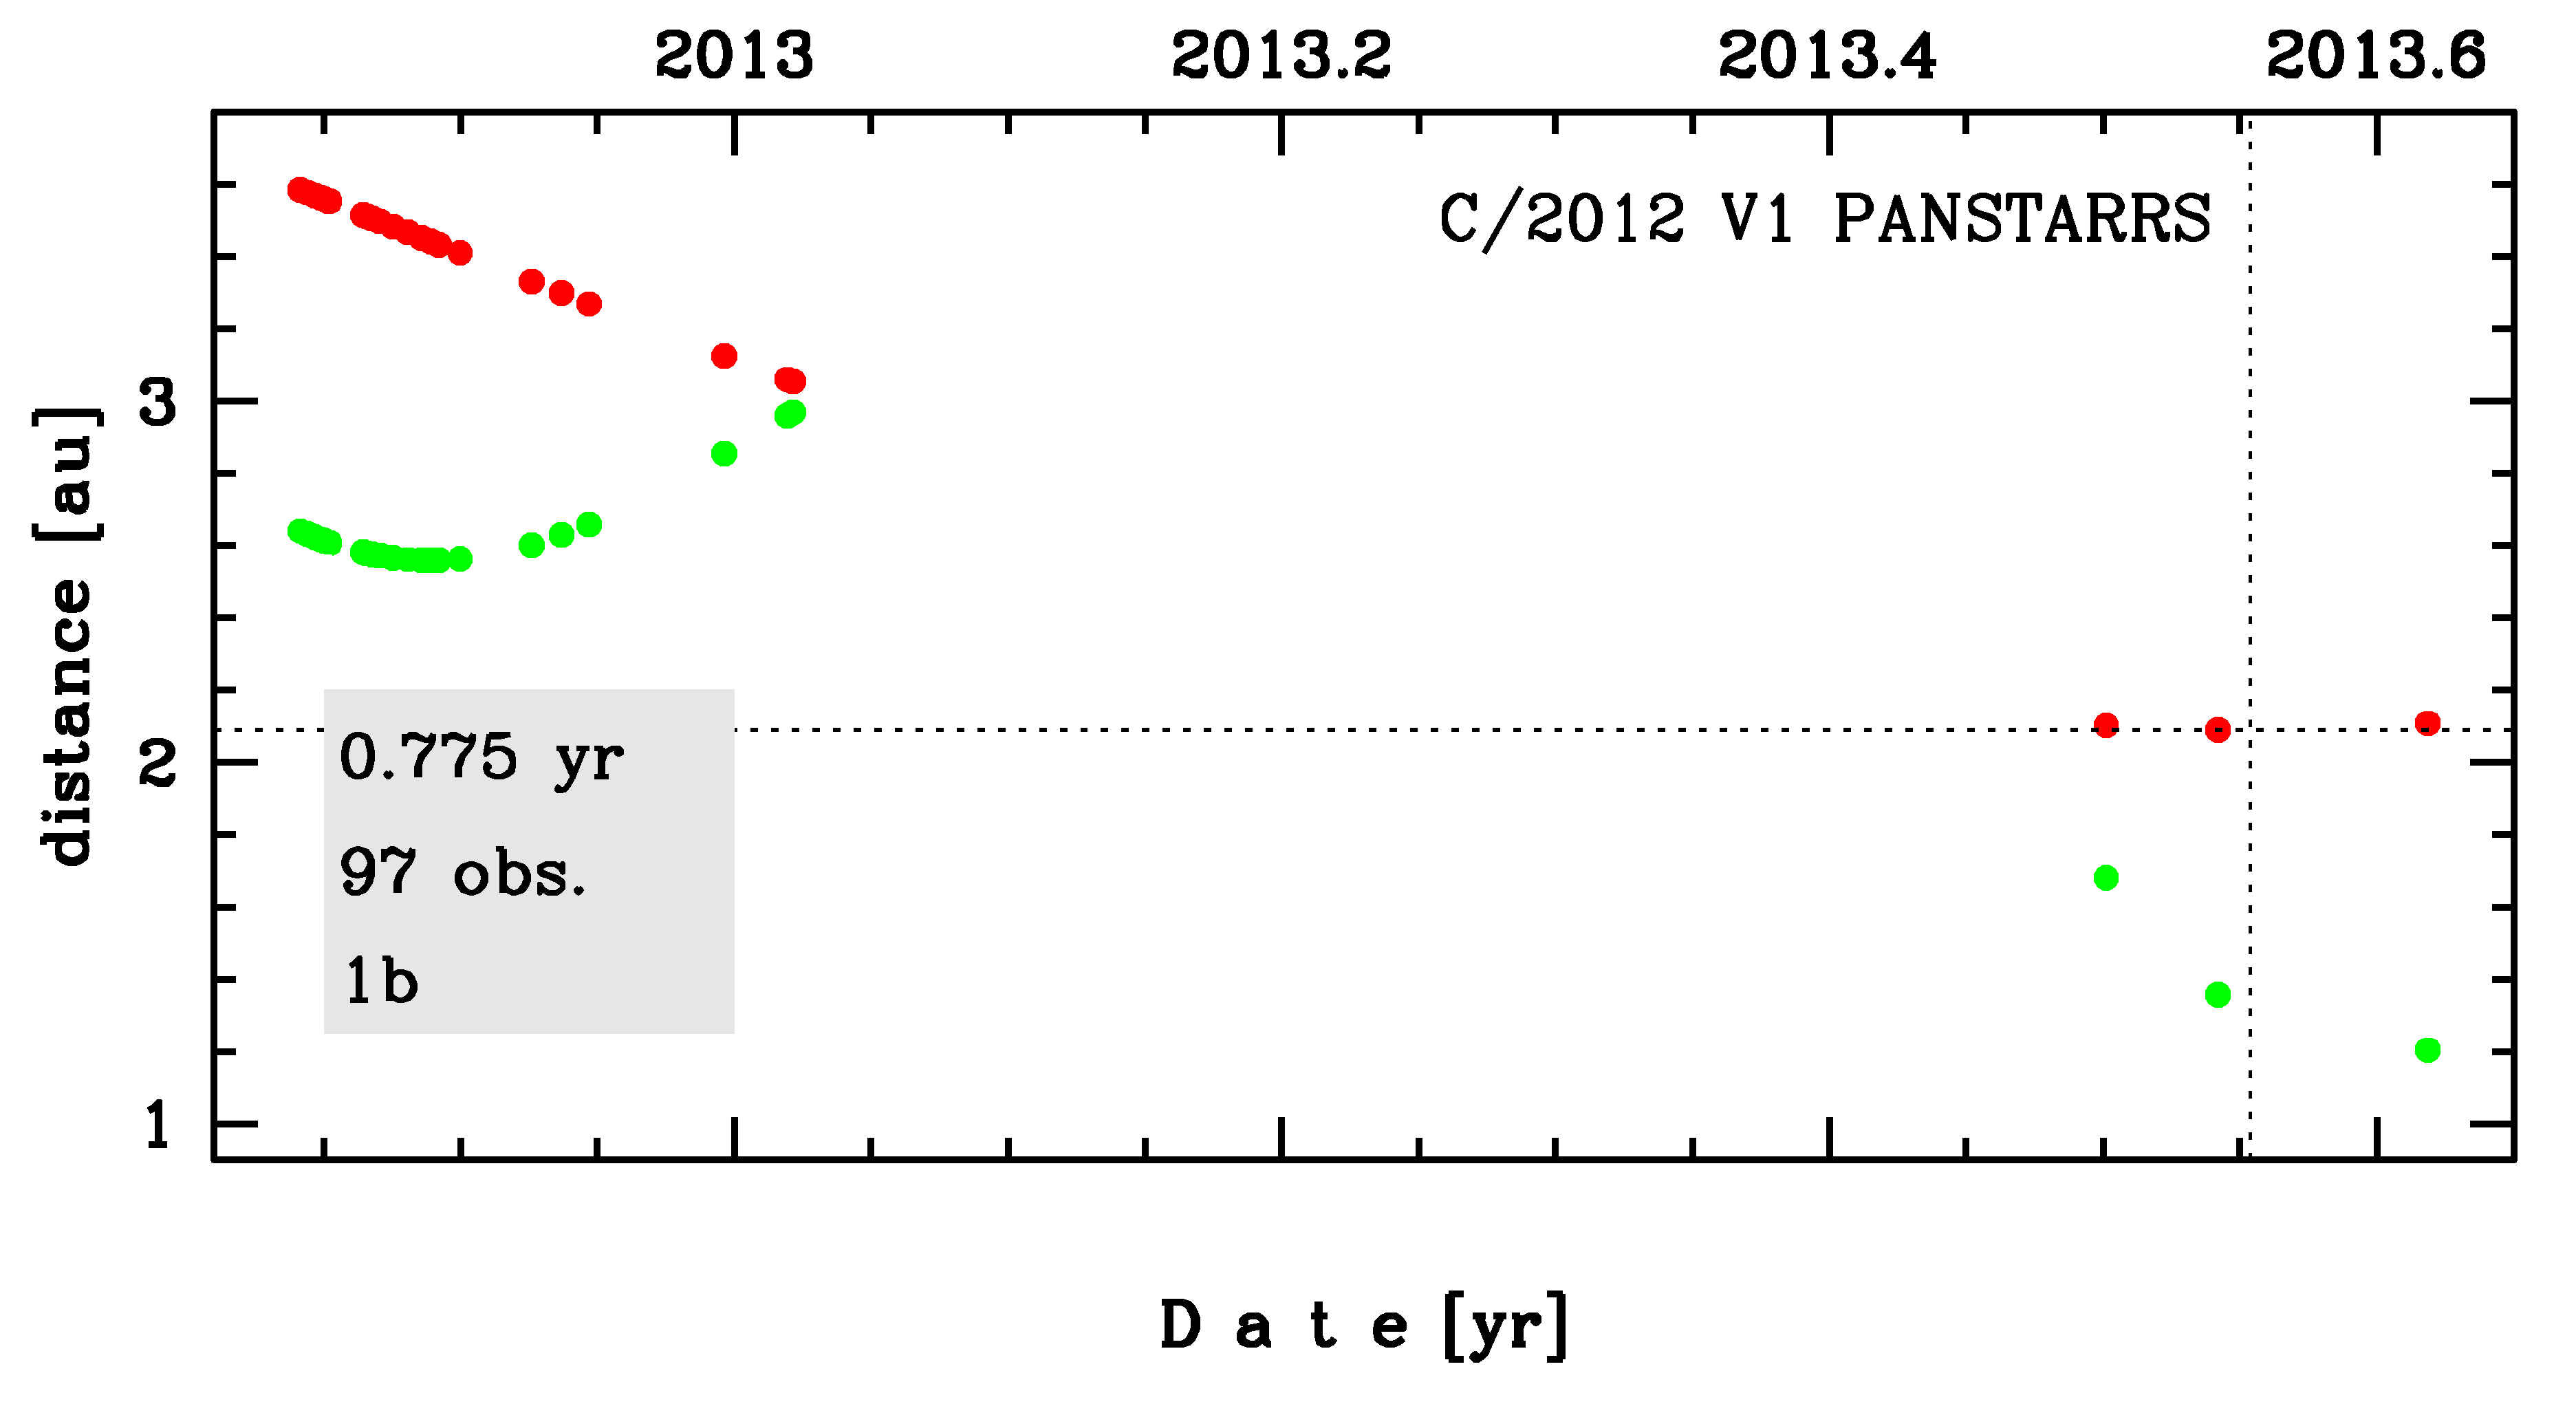
Time distribution of positional observations with corresponding heliocentric (red curve) and geocentric (green curve) distance at which they were taken. The horizontal dotted line shows the perihelion distance for a given comet whereas vertical dotted line — the moment of perihelion passage.
| next_g orbit statistics, here only the Galactic tide has been included | ||
|---|---|---|
| no. of returning VCs in the swarm | 5001 | * |
| no. of escaping VCs in the swarm | 0 | |
| no. of hyperbolas among escaping VCs in the swarm | 0 | |
| next reciprocal semi-major axis [10-6 au-1] | 784.93 – 787.89 – 790.85 | |
| next perihelion distance [au] | 2.09076 – 2.09077 – 2.09077 | |
| next aphelion distance [103 au] | 2.527 – 2.536 – 2.546 | |
| time interval to next perihelion [Myr] | 0.04464 – 0.04489 – 0.04514 | |
| percentage of VCs with qnext < 10 | 100 | |