C/2013 E1 McNaught
more info
Comet C/2013 E1 was discovered on 4 March 2013 by Robert H. McNaught (Siding Spring), that is about 3 months before its perihelion passage. Next, it was found on earlier images taken on 2 and 19 April 2012 and 16 May 2012 with the Siding Spring Survey.
Comet had its closest approach to the Earth on 28 March 2013 (6.848 au, 2.5 months before perihelion passage, see figure).
Solution given here is based on 2-yr observations taken in a range of heliocentric distances: 8.23 au – 7.782 au (perihelion) – 7.99 au.
This Oort spike comet suffers a very slight planetary perturbations during its passage through the planetary system.
See also Królikowska and Dybczyński 2017.
| solution description | ||
|---|---|---|
| number of observations | 176 | |
| data interval | 2012 04 02 – 2014 03 30 | |
| data type | perihelion within the observation arc (FULL) | |
| data arc selection | entire data set (STD) | |
| range of heliocentric distances | 8.23 au – 7.78 au (perihelion) – 7.99 au | |
| detectability of NG effects in the comet's motion | NG effects not determinable | |
| type of model of motion | GR - gravitational orbit | |
| data weighting | YES | |
| number of residuals | 337 | |
| RMS [arcseconds] | 0.39 | |
| orbit quality class | 1a | |
| next orbit statistics, both Galactic and stellar perturbations were taken into account | ||
|---|---|---|
| no. of returning VCs in the swarm | 5001 | * |
| no. of escaping VCs in the swarm | 0 | |
| no. of hyperbolas among escaping VCs in the swarm | 0 | |
| next reciprocal semi-major axis [10-6 au-1] | 84.62 – 85.90 – 87.51 | |
| next perihelion distance [au] | 7.21 – 7.637 – 7.646 | |
| next aphelion distance [103 au] | 22.8 – 23.3 – 23.6 | |
| time interval to next perihelion [Myr] | 1.22 – 1.26 – 1.3 | |
| percentage of VCs with qnext < 10 | 100 | |
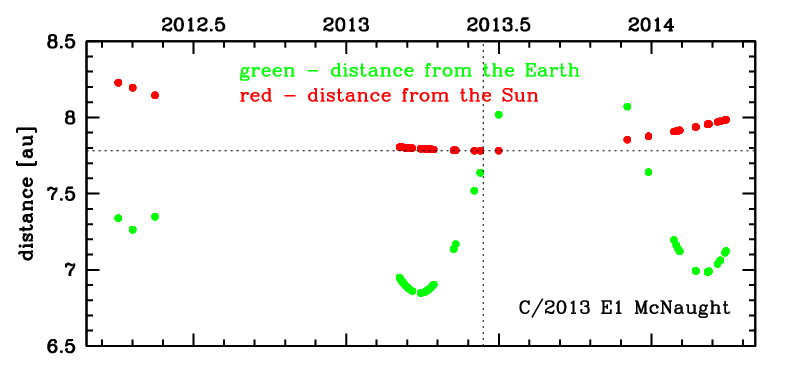
Time distribution of positional observations with corresponding heliocentric (red curve) and geocentric (green curve) distance at which they were taken. The horizontal dotted line shows the perihelion distance for a given comet whereas vertical dotted line — the moment of perihelion passage.
| next_g orbit statistics, here only the Galactic tide has been included | ||
|---|---|---|
| no. of returning VCs in the swarm | 5001 | * |
| no. of escaping VCs in the swarm | 0 | |
| no. of hyperbolas among escaping VCs in the swarm | 0 | |
| next reciprocal semi-major axis [10-6 au-1] | 83.78 – 85.67 – 87.55 | |
| next perihelion distance [au] | 7.569 – 7.585 – 7.598 | |
| next aphelion distance [103 au] | 22.8 – 23.3 – 23.9 | |
| time interval to next perihelion [Myr] | 1.22 – 1.26 – 1.3 | |
| percentage of VCs with qnext < 10 | 100 | |