C/2013 G9 Tenagra
more info
Comet C/2013 G9 was discovered on 15 April 2013 with Tenagra II telescope (near Nogales, U.S.A.), that is a year and 9 months before its perihelion passage. Soon, it was found on earlier images taken on 9 April 2013 with the VHS-VISTA, Cerro Paranal. This comet was observed during four oppositions until 6 April 2016.
Comet had its closest approach to the Earth on 26 March 2015 (4.424 au), about 2.5 months after perihelion passage.
Solution given here is based on data spanning over 2.99 yr in a range of heliocentric distances: 7.10 au – 5.337 au (perihelion) – 6.27 au.
This Oort spike comet suffers very slight planetary perturbations during its passage through the planetary system and in the next perihelion passage it will be an Oort spike comet.
| solution description | ||
|---|---|---|
| number of observations | 515 | |
| data interval | 2013 04 09 – 2016 04 06 | |
| data type | perihelion within the observation arc (FULL) | |
| data arc selection | entire data set (STD) | |
| range of heliocentric distances | 7.1 au – 5.34 au (perihelion) – 6.27 au | |
| detectability of NG effects in the comet's motion | NG effects not determinable | |
| type of model of motion | GR - gravitational orbit | |
| data weighting | YES | |
| number of residuals | 1002 | |
| RMS [arcseconds] | 0.36 | |
| orbit quality class | 1a+ | |
| next orbit statistics, both Galactic and stellar perturbations were taken into account | ||
|---|---|---|
| no. of returning VCs in the swarm | 5001 | * |
| no. of escaping VCs in the swarm | 0 | |
| no. of hyperbolas among escaping VCs in the swarm | 0 | |
| next reciprocal semi-major axis [10-6 au-1] | 88.44 – 89.05 – 89.66 | |
| next perihelion distance [au] | 5.37994 – 5.38026 – 5.38059 | |
| next aphelion distance [103 au] | 22.3 – 22.45 – 22.61 | |
| time interval to next perihelion [Myr] | 1.18 – 1.19 – 1.2 | |
| percentage of VCs with qnext < 10 | 100 | |
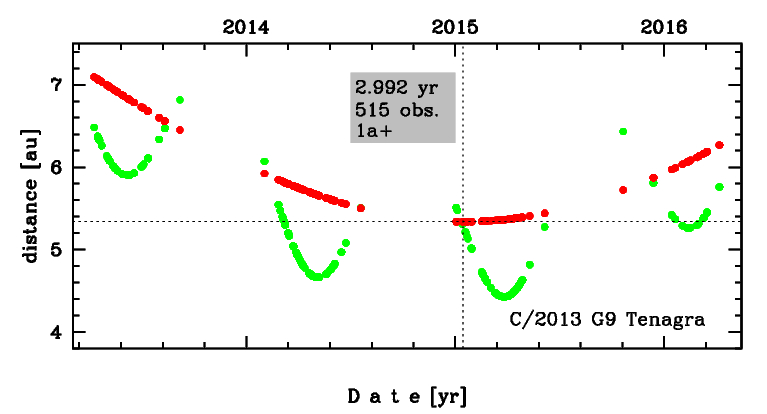
Time distribution of positional observations with corresponding heliocentric (red curve) and geocentric (green curve) distance at which they were taken. The horizontal dotted line shows the perihelion distance for a given comet whereas vertical dotted line — the moment of perihelion passage.
| next_g orbit statistics, here only the Galactic tide has been included | ||
|---|---|---|
| no. of returning VCs in the swarm | 5001 | * |
| no. of escaping VCs in the swarm | 0 | |
| no. of hyperbolas among escaping VCs in the swarm | 0 | |
| next reciprocal semi-major axis [10-6 au-1] | 88.47 – 89.08 – 89.69 | |
| next perihelion distance [au] | 5.3704 – 5.3715 – 5.3727 | |
| next aphelion distance [103 au] | 22.29 – 22.45 – 22.6 | |
| time interval to next perihelion [Myr] | 1.18 – 1.19 – 1.2 | |
| percentage of VCs with qnext < 10 | 100 | |