C/2013 H2 Boattini
more info
Comet C/2013 H2 was discovered on 22 April 2013 by Andrea Boattini with Catalina Sky Survey, that is 9 months before its perihelion passage. This comet was observed during three oppositions until 11 June 2015.
Comet had its closest approaches to the Earth on 3 June 2013 (6.672 au), about 1.5 month after discovery; however, and in the next oppositions it approached the Earth at the similar distance on 10 May 2014 (6.700 au), 3.5 months after perihelion passage.
Solution given here is based on data spanning over 2.14 yr in a range of heliocentric distances: 7.70 au – 7.499 au (perihelion) – 8.13 au.
This comet (original semimajor axis a bit shorter than 10000 au) suffers insignificant planetary perturbations during its passage through the planetary system and its future semimajor axis will be almost unchanged after leaving the planetary zone.
| solution description | ||
|---|---|---|
| number of observations | 223 | |
| data interval | 2013 04 22 – 2015 06 11 | |
| data type | perihelion within the observation arc (FULL) | |
| data arc selection | entire data set (STD) | |
| range of heliocentric distances | 7.7 au – 7.50 au (perihelion) – 8.13 au | |
| detectability of NG effects in the comet's motion | NG effects not determinable | |
| type of model of motion | GR - gravitational orbit | |
| data weighting | YES | |
| number of residuals | 438 | |
| RMS [arcseconds] | 0.44 | |
| orbit quality class | 1a | |
| next orbit statistics, both Galactic and stellar perturbations were taken into account | ||
|---|---|---|
| no. of returning VCs in the swarm | 5001 | * |
| no. of escaping VCs in the swarm | 0 | |
| no. of hyperbolas among escaping VCs in the swarm | 0 | |
| next reciprocal semi-major axis [10-6 au-1] | 107.08 – 109.32 – 111.57 | |
| next perihelion distance [au] | 7.147 – 7.172 – 7.195 | |
| next aphelion distance [103 au] | 17.9 – 18.3 – 18.7 | |
| time interval to next perihelion [Myr] | 0.848 – 0.874 – 0.901 | |
| percentage of VCs with qnext < 10 | 100 | |
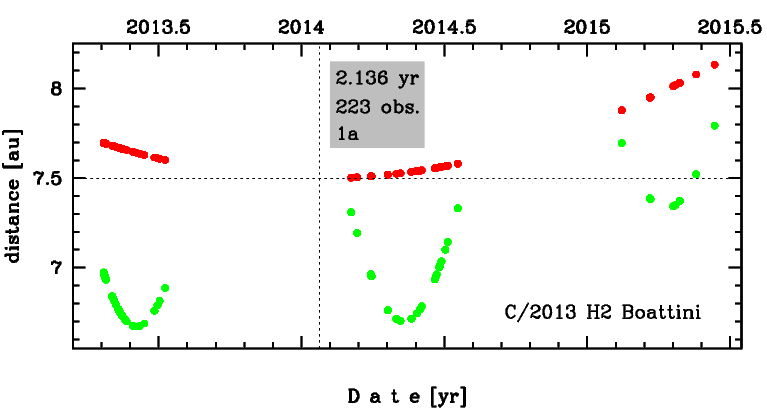
Time distribution of positional observations with corresponding heliocentric (red curve) and geocentric (green curve) distance at which they were taken. The horizontal dotted line shows the perihelion distance for a given comet whereas vertical dotted line — the moment of perihelion passage.
| next_g orbit statistics, here only the Galactic tide has been included | ||
|---|---|---|
| no. of returning VCs in the swarm | 5001 | * |
| no. of escaping VCs in the swarm | 0 | |
| no. of hyperbolas among escaping VCs in the swarm | 0 | |
| next reciprocal semi-major axis [10-6 au-1] | 107.07 – 109.31 – 111.56 | |
| next perihelion distance [au] | 7.137 – 7.162 – 7.184 | |
| next aphelion distance [103 au] | 17.9 – 18.3 – 18.7 | |
| time interval to next perihelion [Myr] | 0.848 – 0.874 – 0.901 | |
| percentage of VCs with qnext < 10 | 100 | |