C/2013 L2 Catalina
more info
Comet C/2013 L2 was discovered on 2 June 2013 with the Catalina Sky Survey, that is more than one year after perihelion passage, and next observed 121 days (0.33 yr) in a range of heliocentric distances from 5.71 au to 6.22 au.
Comet had its closest approach to the Earth on 2 July 2012 (3.888 au), less than two months after perihelion.
C/2013 L2 suffered small planetary perturbations during its passage through the planetary system.
This Oort spike comet suffers small planetary perturbations during its passage through the planetary system; these perturbations lead to a more tight future orbit (see future barycentric orbits).
See also Królikowska and Dybczyński 2017.
| solution description | ||
|---|---|---|
| number of observations | 242 | |
| data interval | 2013 06 02 – 2013 10 01 | |
| data type | observed only after perihelion (POST) | |
| data arc selection | entire data set (STD) | |
| range of heliocentric distances | 5.71 au – 6.22au | |
| detectability of NG effects in the comet's motion | NG effects not determinable | |
| type of model of motion | GR - gravitational orbit | |
| data weighting | YES | |
| number of residuals | 471 | |
| RMS [arcseconds] | 0.32 | |
| orbit quality class | 2a | |
| next orbit statistics, both Galactic and stellar perturbations were taken into account | ||
|---|---|---|
| no. of returning VCs in the swarm | 5001 | * |
| no. of escaping VCs in the swarm | 0 | |
| no. of hyperbolas among escaping VCs in the swarm | 0 | |
| next reciprocal semi-major axis [10-6 au-1] | 198.61 – 223.31 – 247.19 | |
| next perihelion distance [au] | 4.8785 – 4.8799 – 4.8823 | |
| next aphelion distance [103 au] | 8.09 – 8.95 – 10.1 | |
| time interval to next perihelion [Myr] | 0.26 – 0.3 – 0.36 | |
| percentage of VCs with qnext < 10 | 100 | |
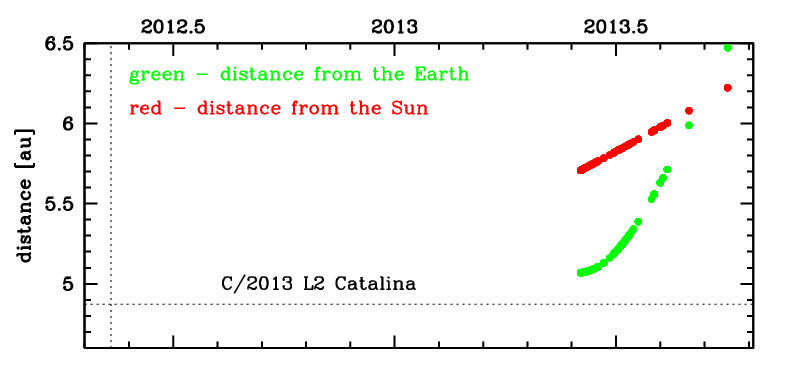
Time distribution of positional observations with corresponding heliocentric (red curve) and geocentric (green curve) distance at which they were taken. The horizontal dotted line shows the perihelion distance for a given comet whereas vertical dotted line — the moment of perihelion passage.
| next_g orbit statistics, here only the Galactic tide has been included | ||
|---|---|---|
| no. of returning VCs in the swarm | 5001 | * |
| no. of escaping VCs in the swarm | 0 | |
| no. of hyperbolas among escaping VCs in the swarm | 0 | |
| next reciprocal semi-major axis [10-6 au-1] | 198.59 – 223.29 – 247.18 | |
| next perihelion distance [au] | 4.8775 – 4.879 – 4.8815 | |
| next aphelion distance [103 au] | 8.09 – 8.95 – 10.1 | |
| time interval to next perihelion [Myr] | 0.26 – 0.3 – 0.36 | |
| percentage of VCs with qnext < 10 | 100 | |