C/2013 P3 Palomar
more info
Comet C/2013 P3 was discovered on 9 August 2013 with Palomar Transient Factory survey, that is about 1.3 yr before its perihelion passage. Next, it was found on images taken the day before discovery during the same survey. This comet was observed until 24 June 2018.
Comet had its closest approach to the Earth on 21 September 2014 (7.657 au), about 2 months before perihelion passage.
Solution given here is based on data spanning over 4.88 yr in a range of heliocentric distances: 9.070 au – 8.647 au (perihelion) – 11.42 au.
This Oort spike comet suffers so tiny planetary perturbations during its passage through the planetary system that its semimajor axis will be almost unchanged after leaving the planetary zone.< br>
| solution description | ||
|---|---|---|
| number of observations | 494 | |
| data interval | 2013 08 08 – 2018 06 24 | |
| data type | perihelion within the observation arc (FULL) | |
| data arc selection | entire data set (STD) | |
| range of heliocentric distances | 9.07 au – 8.65 au (perihelion) – 11.4 au | |
| detectability of NG effects in the comet's motion | NG effects not determinable | |
| type of model of motion | GR - gravitational orbit | |
| data weighting | YES | |
| number of residuals | 980 | |
| RMS [arcseconds] | 0.29 | |
| orbit quality class | 1a+ | |
| orbital elements (barycentric ecliptic J2000) | ||
|---|---|---|
| Epoch | 1703 01 14 | |
| perihelion date | 2014 11 22.85685850 | ± 0.00132499 |
| perihelion distance [au] | 8.64817340 | ± 0.00000703 |
| eccentricity | 0.99966583 | ± 0.00000585 |
| argument of perihelion [°] | 177.150987 | ± 0.000069 |
| ascending node [°] | 177.264014 | ± 0.000005 |
| inclination [°] | 93.875095 | ± 0.000013 |
| reciprocal semi-major axis [10-6 au-1] | 38.64 | ± 0.68 |
| file containing 5001 VCs swarm |
|---|
| 2013p3b5.bmi |
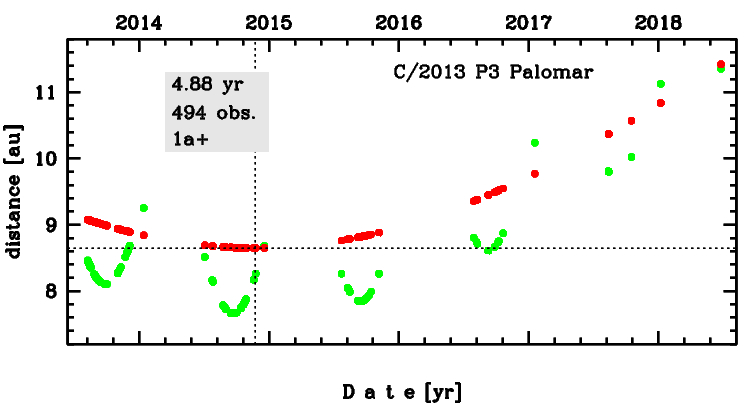
Time distribution of positional observations with corresponding heliocentric (red curve) and geocentric (green curve) distance at which they were taken. The horizontal dotted line shows the perihelion distance for a given comet whereas vertical dotted line — the moment of perihelion passage.
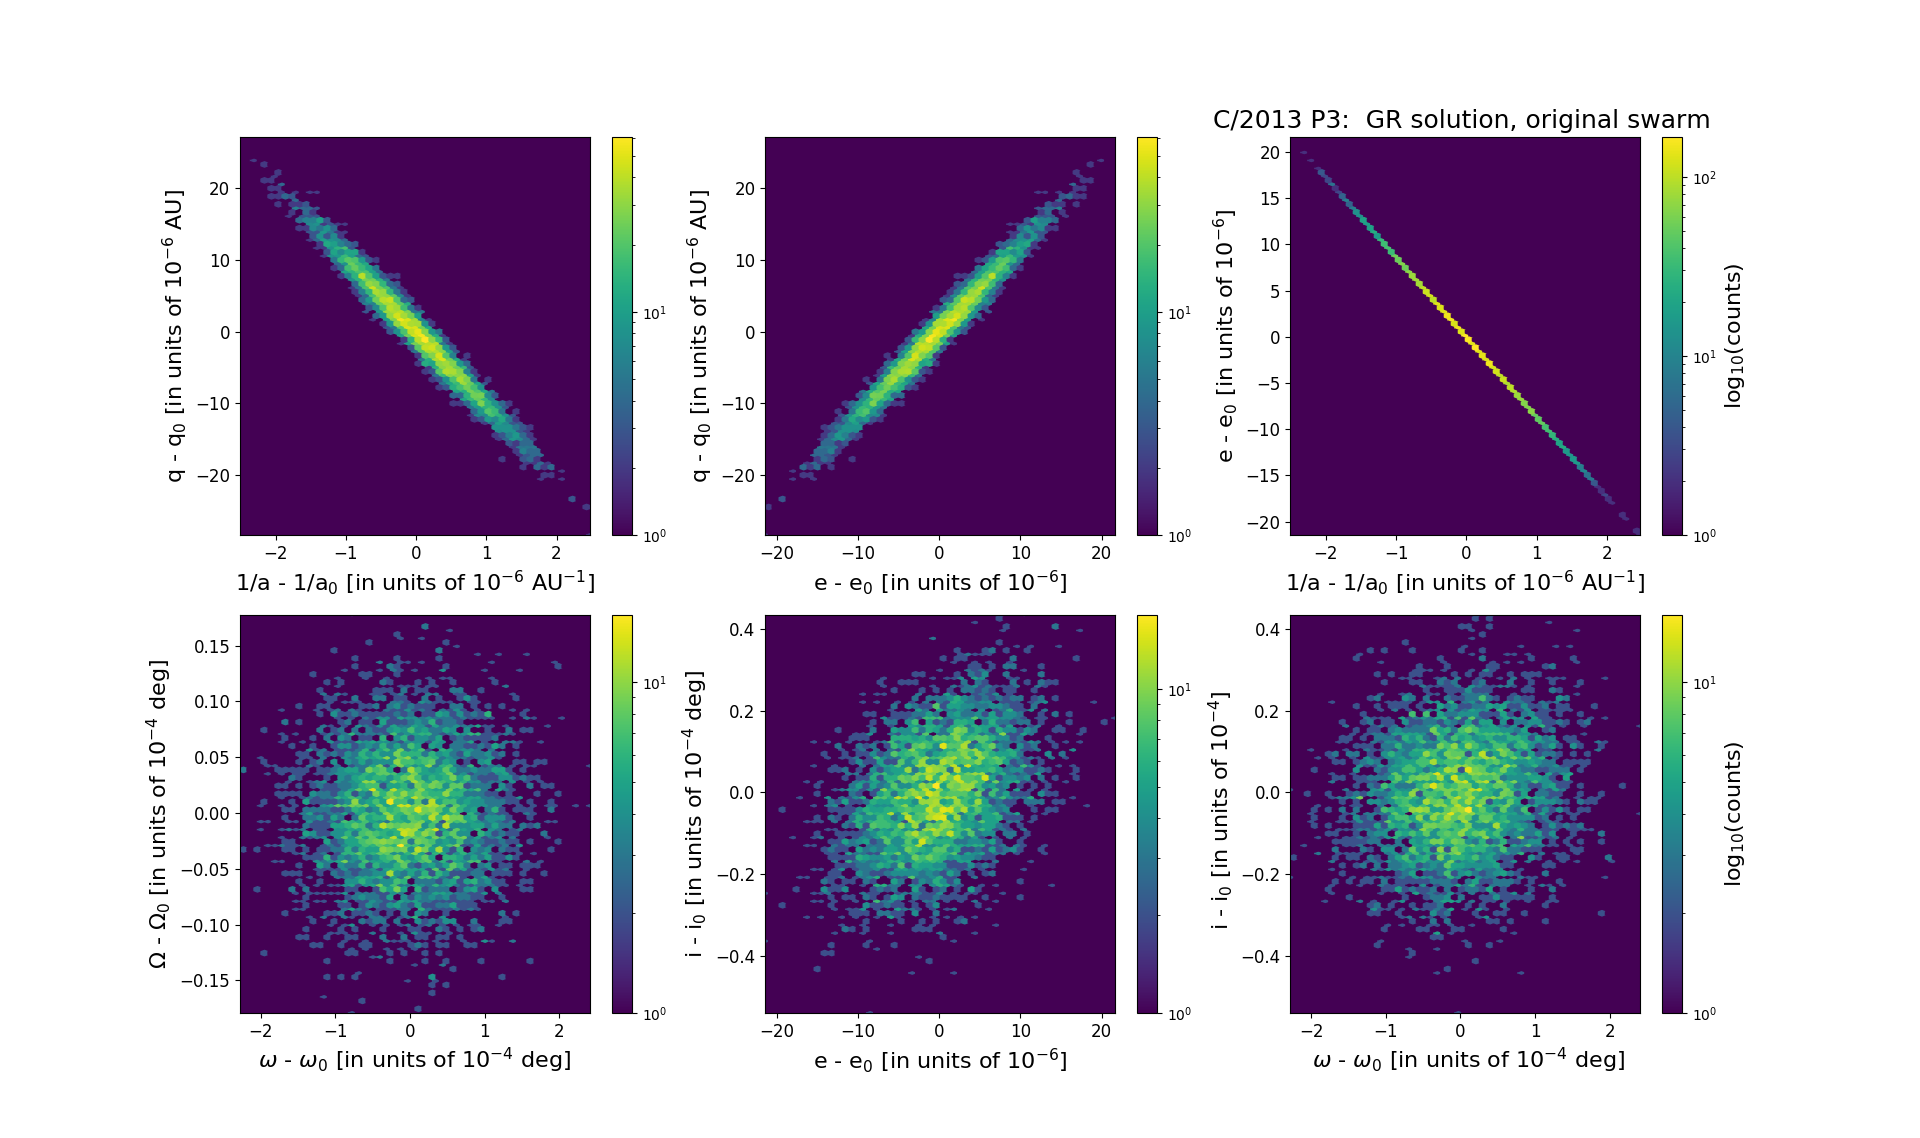
Six 2D-projections of the 6D space of original swarm including 5001 VCs. Each density map is given in logarithmic scale presented on the right in the individual panel.