C/2014 N3 NEOWISE
more info
Comet C/2014 N3 was discovered on 4 July 2014 with Near-Earth Object Wide-field Infrared Survey Explorer, that is more than 8 months before its perihelion passage. This comet was observed until 6 January 2017.
Comet had its closest approach to the Earth on 9 October 2014 (3.30 au), five months before perihelion passage.
Solutions given here are based on data spanning over 2.51 yr in a range of heliocentric distances: 4.45 au – 3.882 au (perihelion) – 6.70 au.
This Oort spike comet suffers moderate planetary perturbations during its passage through the planetary system; these perturbations lead to a more tight future orbit (see future barycentric orbits).
| solution description | ||
|---|---|---|
| number of observations | 1610 | |
| data interval | 2014 07 04 – 2017 01 06 | |
| data type | perihelion within the observation arc (FULL) | |
| data arc selection | entire data set (STD) | |
| range of heliocentric distances | 4.45 au – 3.88 au (perihelion) – 6.7 au | |
| type of model of motion | NC - non-gravitational orbits for symmetric CO-g(r)-like function | |
| data weighting | YES | |
| number of residuals | 3164 | |
| RMS [arcseconds] | 0.38 | |
| orbit quality class | 1a+ | |
| previous orbit statistics, both Galactic and stellar perturbations were taken into account | ||
|---|---|---|
| no. of returning VCs in the swarm | 5001 | * |
| no. of escaping VCs in the swarm | 0 | |
| no. of hyperbolas among escaping VCs in the swarm | 0 | |
| previous reciprocal semi-major axis [10-6 au-1] | 33.07 – 36.03 – 39.09 | |
| previous perihelion distance [au] | 225 – 253 – 278 | |
| previous aphelion distance [103 au] | 50.9 – 55.3 – 60.2 | |
| time interval to previous perihelion [Myr] | 4.4 – 4.9 – 5.4 | |
| percentage of VCs with qprev > 20 | 100 | |
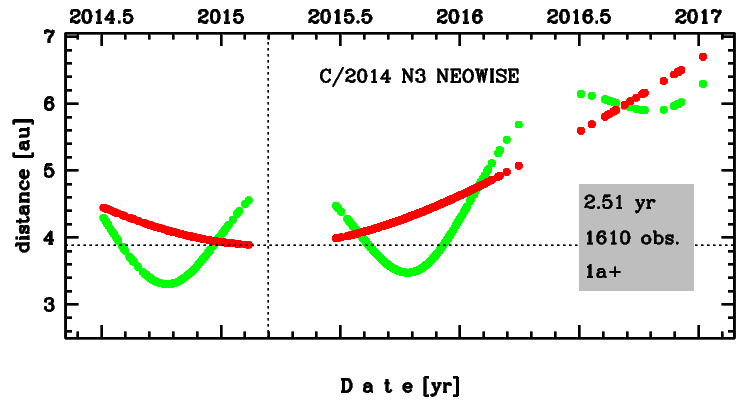
Time distribution of positional observations with corresponding heliocentric (red curve) and geocentric (green curve) distance at which they were taken. The horizontal dotted line shows the perihelion distance for a given comet whereas vertical dotted line — the moment of perihelion passage.
| previous_g orbit statistics, here only the Galactic tide has been included | ||
|---|---|---|
| no. of returning VCs in the swarm | 5001 | * |
| no. of escaping VCs in the swarm | 0 | |
| no. of hyperbolas among escaping VCs in the swarm | 0 | |
| previous reciprocal semi-major axis [10-6 au-1] | 33.70 – 36.00 – 38.33 | |
| previous perihelion distance [au] | 0.2 – 0.39 – 1.2 | |
| previous aphelion distance [103 au] | 52.2 – 55.5 – 59.3 | |
| time interval to previous perihelion [Myr] | 4.14 – 4.53 – 4.98 | |
| percentage of VCs with qprev < 10 | 100 | |