C/2014 UN271 Bernardinelli-Bernstein
more info
The discovery of C/2014 UN271 was announced in June 2021 by Bernardinelli & Bernstein (2021) on the basis of astrometric observations spanning 20 nights from 20 October 2014 to 8 November 2018 (29.0 au–23.7 au from the Sun). A little later, at a heliocentric distance of over 20 au, observers reported the cometary activity of C/2014 UN271.
The comet will pass through perihelion (10.95 au from the Sun) on 22 January 2031; thus solutions given here are currently based on pre-perihelion data taken at large heliocentric distances.
GR solution 'b8' perfectly fits the data; however, GR solution 'd5' based on longer data arc shows that something happened at the end of 2021 because some trend are visible in the period 2010-2020. For example, there may have been some more violent activity associated with the breakaway of a comet fragment as early as late 2021 (heliocentric distance of about 20 au; see [O-C] for the 'ba' solution). These trends in [O-C] indicates that the outburst reported by Kokotanekova et al (2024) was associated with a noticeable action of NG acceleration forces on the comet's motion. This is all the more interesting because it is a very large comet, with a size estimated at 60 km thanks to ALMA and HST observations.
Most probably, this Oort spike comet suffers small planetary perturbations during its passage through the planetary system.
More details about orbital fitting before the year 2022: see Dybczyński and Królikowska (2022)
| solution description | ||
|---|---|---|
| number of observations | 114 | |
| data interval | 2010 11 15 – 2021 09 19 | |
| data arc selection | data generally limited to pre-perihelion (PRE) | |
| range of heliocentric distances | 34.07 au – 19.85au | |
| detectability of NG effects in the comet's motion | NG effects not determinable | |
| type of model of motion | GR - gravitational orbit | |
| data weighting | YES | |
| number of residuals | 210 | |
| RMS [arcseconds] | 0.13 | |
| orbit quality class | 1a+ | |
| next orbit statistics, both Galactic and stellar perturbations were taken into account | ||
|---|---|---|
| no. of returning VCs in the swarm | 5001 | * |
| no. of escaping VCs in the swarm | 0 | |
| no. of hyperbolas among escaping VCs in the swarm | 0 | |
| next reciprocal semi-major axis [10-6 au-1] | 35.47 – 36.21 – 36.97 | |
| next perihelion distance [au] | 10.8 – 11.4 – 11.9 | |
| next aphelion distance [103 au] | 54.1 – 55.2 – 56.4 | |
| time interval to next perihelion [Myr] | 4.47 – 4.61 – 4.75 | |
| percentage of VCs with 10 < qnext < 20 | 100 | |
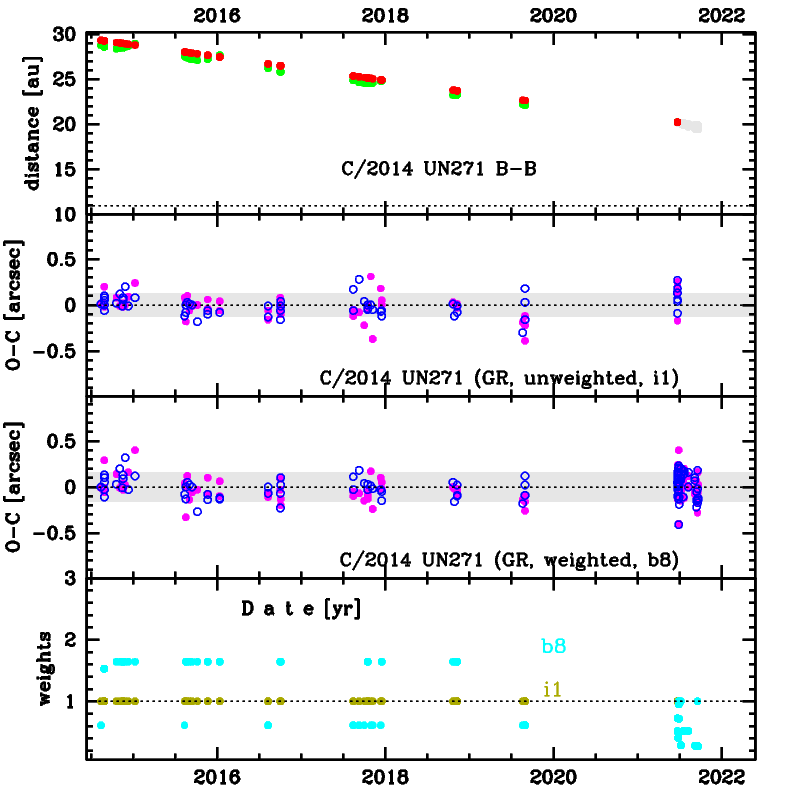
Upper panel: Time distribution of positional observations with corresponding heliocentric (red curve) and geocentric (green curve) distance at which they were taken. The horizontal dotted line shows the perihelion distance for a given comet whereas vertical dotted line — the moment of perihelion passage.
Middle panel(s): O-C diagram for a given solution (sometimes in comparison to another solution available in CODE), where residuals in right ascension are shown using magenta dots and in declination by blue open circles.
Lowest panel: Relative weights for a given data set(s).
Middle panel(s): O-C diagram for a given solution (sometimes in comparison to another solution available in CODE), where residuals in right ascension are shown using magenta dots and in declination by blue open circles.
Lowest panel: Relative weights for a given data set(s).
| next_g orbit statistics, here only the Galactic tide has been included | ||
|---|---|---|
| no. of returning VCs in the swarm | 5001 | * |
| no. of escaping VCs in the swarm | 0 | |
| no. of hyperbolas among escaping VCs in the swarm | 0 | |
| next reciprocal semi-major axis [10-6 au-1] | 36.35 – 37.06 – 37.79 | |
| next perihelion distance [au] | 2.73 – 3.01 – 3.32 | |
| next aphelion distance [103 au] | 52.9 – 54 – 55 | |
| time interval to next perihelion [Myr] | 4.28 – 4.4 – 4.53 | |
| percentage of VCs with qnext < 10 | 100 | |