C/2015 B2 PANSTARRS
more info
Comet C/2015 B2 was discovered on 29 January 2015 with Pan-STARRS 1 telescope (Haleakala), that is about 1.3 yr before its perihelion passage; a few prediscovery images of this comet were found (taken on 6 January with the same survey). This comet was observed until 12 September 2017.
Comet had its closest approach to the Earth on 12 January 2016 (3.625 au), about 4 months before its perihelion passage.
Solution given here is based on data spanning over 2.68 yr in a range of heliocentric distances: 5.48 au – 3.370 au (perihelion) – 5.53 au.
This comet suffers tiny planetary perturbations during its passage through the planetary system; have orignal semimajor axis of about 4,400 au and slightly tighter future orbit (see future barycentric orbit).
| solution description | ||
|---|---|---|
| number of observations | 242 | |
| data interval | 2015 01 06 – 2017 09 12 | |
| data type | perihelion within the observation arc (FULL) | |
| data arc selection | entire data set (STD) | |
| range of heliocentric distances | 5.48 au – 3.37 au (perihelion) – 5.53 au | |
| detectability of NG effects in the comet's motion | NG effects not determinable | |
| type of model of motion | GR - gravitational orbit | |
| data weighting | YES | |
| number of residuals | 464 | |
| RMS [arcseconds] | 0.23 | |
| orbit quality class | 1a+ | |
| orbital elements (heliocentric ecliptic J2000) | ||
|---|---|---|
| Epoch | 2016 05 12 | |
| perihelion date | 2016 05 06.57808382 | ± 0.00007412 |
| perihelion distance [au] | 3.36959203 | ± 0.00000030 |
| eccentricity | 1.00039942 | ± 0.00000120 |
| argument of perihelion [°] | 284.769686 | ± 0.000010 |
| ascending node [°] | 341.902052 | ± 0.000005 |
| inclination [°] | 105.08811 | ± 0.000006 |
| reciprocal semi-major axis [10-6 au-1] | -118.54 | ± 0.35 |
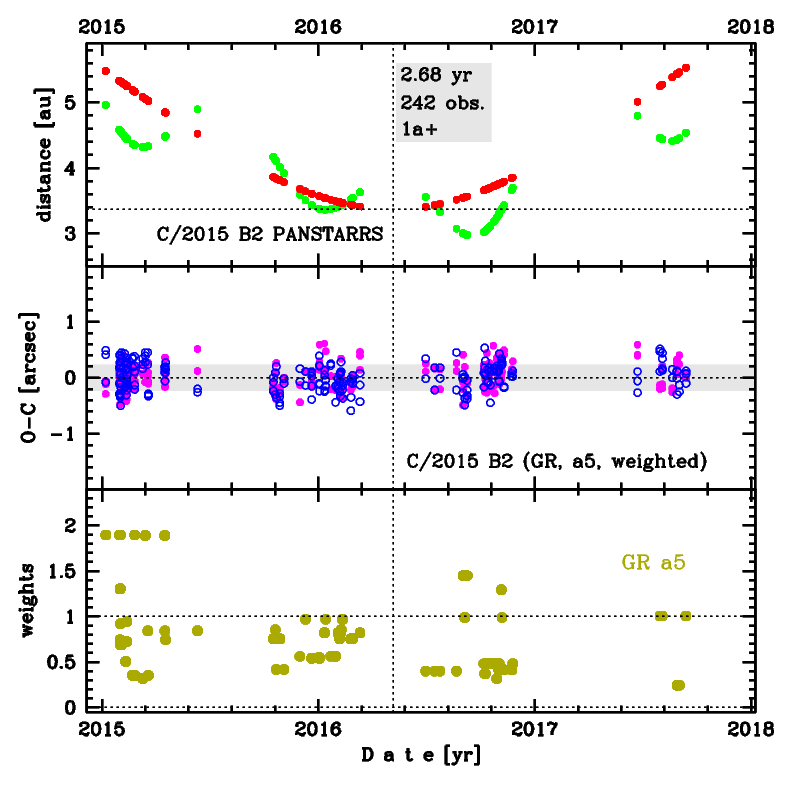
Upper panel: Time distribution of positional observations with corresponding heliocentric (red curve) and geocentric (green curve) distance at which they were taken. The horizontal dotted line shows the perihelion distance for a given comet whereas vertical dotted line — the moment of perihelion passage.
Middle panel(s): O-C diagram for a given solution (sometimes in comparison to another solution available in CODE), where residuals in right ascension are shown using magenta dots and in declination by blue open circles.
Lowest panel: Relative weights for a given data set(s).
Middle panel(s): O-C diagram for a given solution (sometimes in comparison to another solution available in CODE), where residuals in right ascension are shown using magenta dots and in declination by blue open circles.
Lowest panel: Relative weights for a given data set(s).