C/2015 H2 PANSTARRS
more info
Comet C/2015 H2 was discovered on 24 April 2015 with Pan-STARRS 1 telescope (Haleakala), that is about 1.4 year before its perihelion passage. Some prediscovery images of this comet were found: taken on 20 April 2015 by Polonia Observatory (San Pedro de Atacama) and 19 May 2014 by Pan-STARRS 1, Haleakala.This comet was observed until 22 October 2019 (is still observable).
Comet had its closest approach to the Earth on 26 June 2016 (4.196 au), about 2.5 months before its perihelion passage.
NG orbits using full data-arc as well as independently using pre-perihelion and post-perihelion data are determinable.
Solutions given here is based on data spanning over 5.43 yr in a range of heliocentric distances: 7.96 au – 4.960 au (perihelion) – 9.52 au.
This Oort spike comet suffers moderate planetary perturbations during its passage through the planetary system that likely lead to escape the comet from the planetary zone on a hyperbolic orbit (see future barycentric orbits).
See also Królikowska and Dones 2023.
# END of document - 2023 August 10 - MKr
| solution description | ||
|---|---|---|
| number of observations | 206 | |
| data interval | 2014 05 19 – 2019 10 22 | |
| data type | perihelion within the observation arc (FULL) | |
| data arc selection | entire data set (STD) | |
| range of heliocentric distances | 7.96 au – 4.97 au (perihelion) – 9.52 au | |
| type of model of motion | NC - non-gravitational orbits for symmetric CO-g(r)-like function | |
| data weighting | YES | |
| number of residuals | 395 | |
| RMS [arcseconds] | 0.34 | |
| orbit quality class | 1a+ | |
| previous orbit statistics, both Galactic and stellar perturbations were taken into account | ||
|---|---|---|
| no. of returning VCs in the swarm | 5001 | * |
| no. of escaping VCs in the swarm | 0 | |
| no. of hyperbolas among escaping VCs in the swarm | 0 | |
| previous reciprocal semi-major axis [10-6 au-1] | 30.81 – 33.54 – 36.39 | |
| previous perihelion distance [au] | 640 – 720 – 800 | |
| previous aphelion distance [103 au] | 54.3 – 58.9 – 64.1 | |
| time interval to previous perihelion [Myr] | 4.5 – 5.1 – 5.7 | |
| percentage of VCs with qprev > 20 | 100 | |
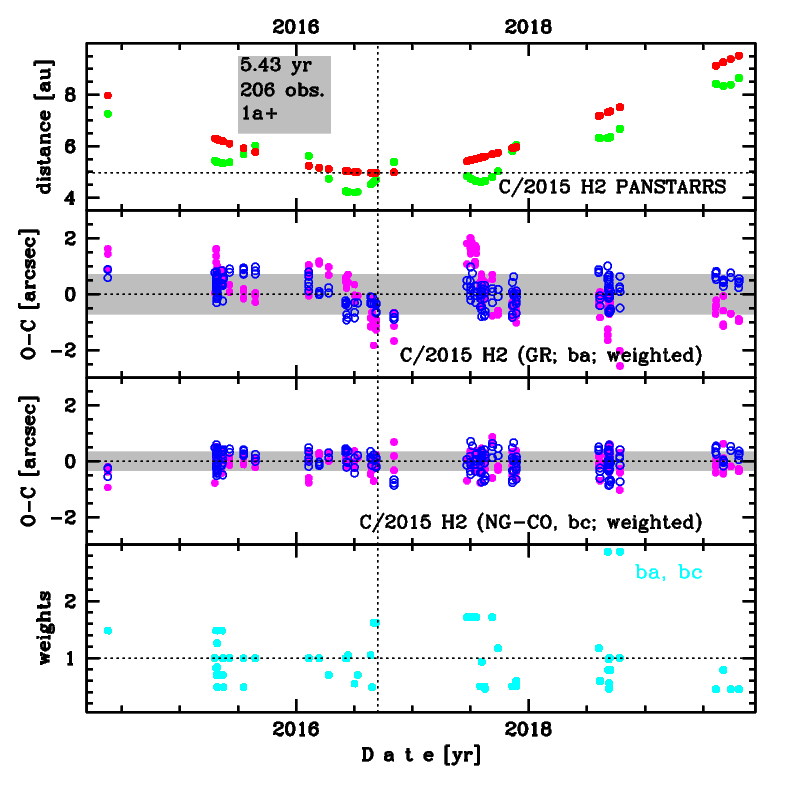
Upper panel: Time distribution of positional observations with corresponding heliocentric (red curve) and geocentric (green curve) distance at which they were taken. The horizontal dotted line shows the perihelion distance for a given comet whereas vertical dotted line — the moment of perihelion passage.
Middle panel(s): O-C diagram for a given solution (sometimes in comparison to another solution available in CODE), where residuals in right ascension are shown using magenta dots and in declination by blue open circles.
Lowest panel: Relative weights for a given data set(s).
Middle panel(s): O-C diagram for a given solution (sometimes in comparison to another solution available in CODE), where residuals in right ascension are shown using magenta dots and in declination by blue open circles.
Lowest panel: Relative weights for a given data set(s).
| previous_g orbit statistics, here only the Galactic tide has been included | ||
|---|---|---|
| no. of returning VCs in the swarm | 5001 | * |
| no. of escaping VCs in the swarm | 0 | |
| no. of hyperbolas among escaping VCs in the swarm | 0 | |
| previous reciprocal semi-major axis [10-6 au-1] | 31.88 – 34.51 – 37.17 | |
| previous perihelion distance [au] | 17 – 22 – 31 | |
| previous aphelion distance [103 au] | 53.8 – 57.9 – 62.7 | |
| time interval to previous perihelion [Myr] | 4.4 – 4.9 – 5.5 | |
| percentage of VCs with 10 < qprev < 20 | 31 | |
| percentage of VCs with qprev > 20 | 69 | |