C/2015 K4 PanSTARRS
more info
Comet C/2015 K4 was discovered on 24 May 2015 by Pan-STARRS 1, Haleakala, that is about three weeks after its perihelion passage. Comet was observed for less than two months until 14 July 2015. C/2015 K4 had closest approach to the Earth on 25 May 2015 (1.061 au, 3.5 weeks after the perihelion passage).
This is a comet with a short data arc and we show here two GR solutions differing in data treatment: 'a5' (data were weighting) and 'a1' (weighting procedure was omitted); bothare based on data spanning over 0.14 yr in a narrow range of heliocentric distances from 2.03 au to 2.20 au.
According to both GR solutions, original semimajor axis of C/2015 K4 is about 1100–1800 au (uncertainty of one sigma was included). Due to moderate planetary perturbations, its future orbit will be much looser; it is uncertain whether this comet will leave the solar system in a hyperbolic orbit.
| solution description | ||
|---|---|---|
| number of observations | 134 | |
| data interval | 2015 05 24 – 2015 07 14 | |
| data type | observed only after perihelion (POST) | |
| data arc selection | entire data set (STD) | |
| range of heliocentric distances | 2.03 au – 2.2au | |
| detectability of NG effects in the comet's motion | NG effects not determinable | |
| type of model of motion | GR - gravitational orbit | |
| data weighting | NO | |
| number of residuals | 259 | |
| RMS [arcseconds] | 0.54 | |
| orbit quality class | 2b | |
| orbital elements (barycentric ecliptic J2000) | ||
|---|---|---|
| Epoch | 1706 08 26 | |
| perihelion date | 2015 05 01.90306449 | ± 0.00215909 |
| perihelion distance [au] | 2.00637729 | ± 0.00005038 |
| eccentricity | 0.99852436 | ± 0.00026157 |
| argument of perihelion [°] | 357.628913 | ± 0.000707 |
| ascending node [°] | 250.832389 | ± 0.000714 |
| inclination [°] | 80.30312 | ± 0.003168 |
| reciprocal semi-major axis [10-6 au-1] | 735.47 | ± 130.39 |
| file containing 5001 VCs swarm |
|---|
| 2015k4a1.bmi |

Upper panel: Time distribution of positional observations with corresponding heliocentric (red curve) and geocentric (green curve) distance at which they were taken. The horizontal dotted line shows the perihelion distance for a given comet whereas vertical dotted line — the moment of perihelion passage.
Middle panel(s): O-C diagram for a given solution (sometimes in comparison to another solution available in CODE), where residuals in right ascension are shown using magenta dots and in declination by blue open circles.
Lowest panel: Relative weights for a given data set(s).
Middle panel(s): O-C diagram for a given solution (sometimes in comparison to another solution available in CODE), where residuals in right ascension are shown using magenta dots and in declination by blue open circles.
Lowest panel: Relative weights for a given data set(s).
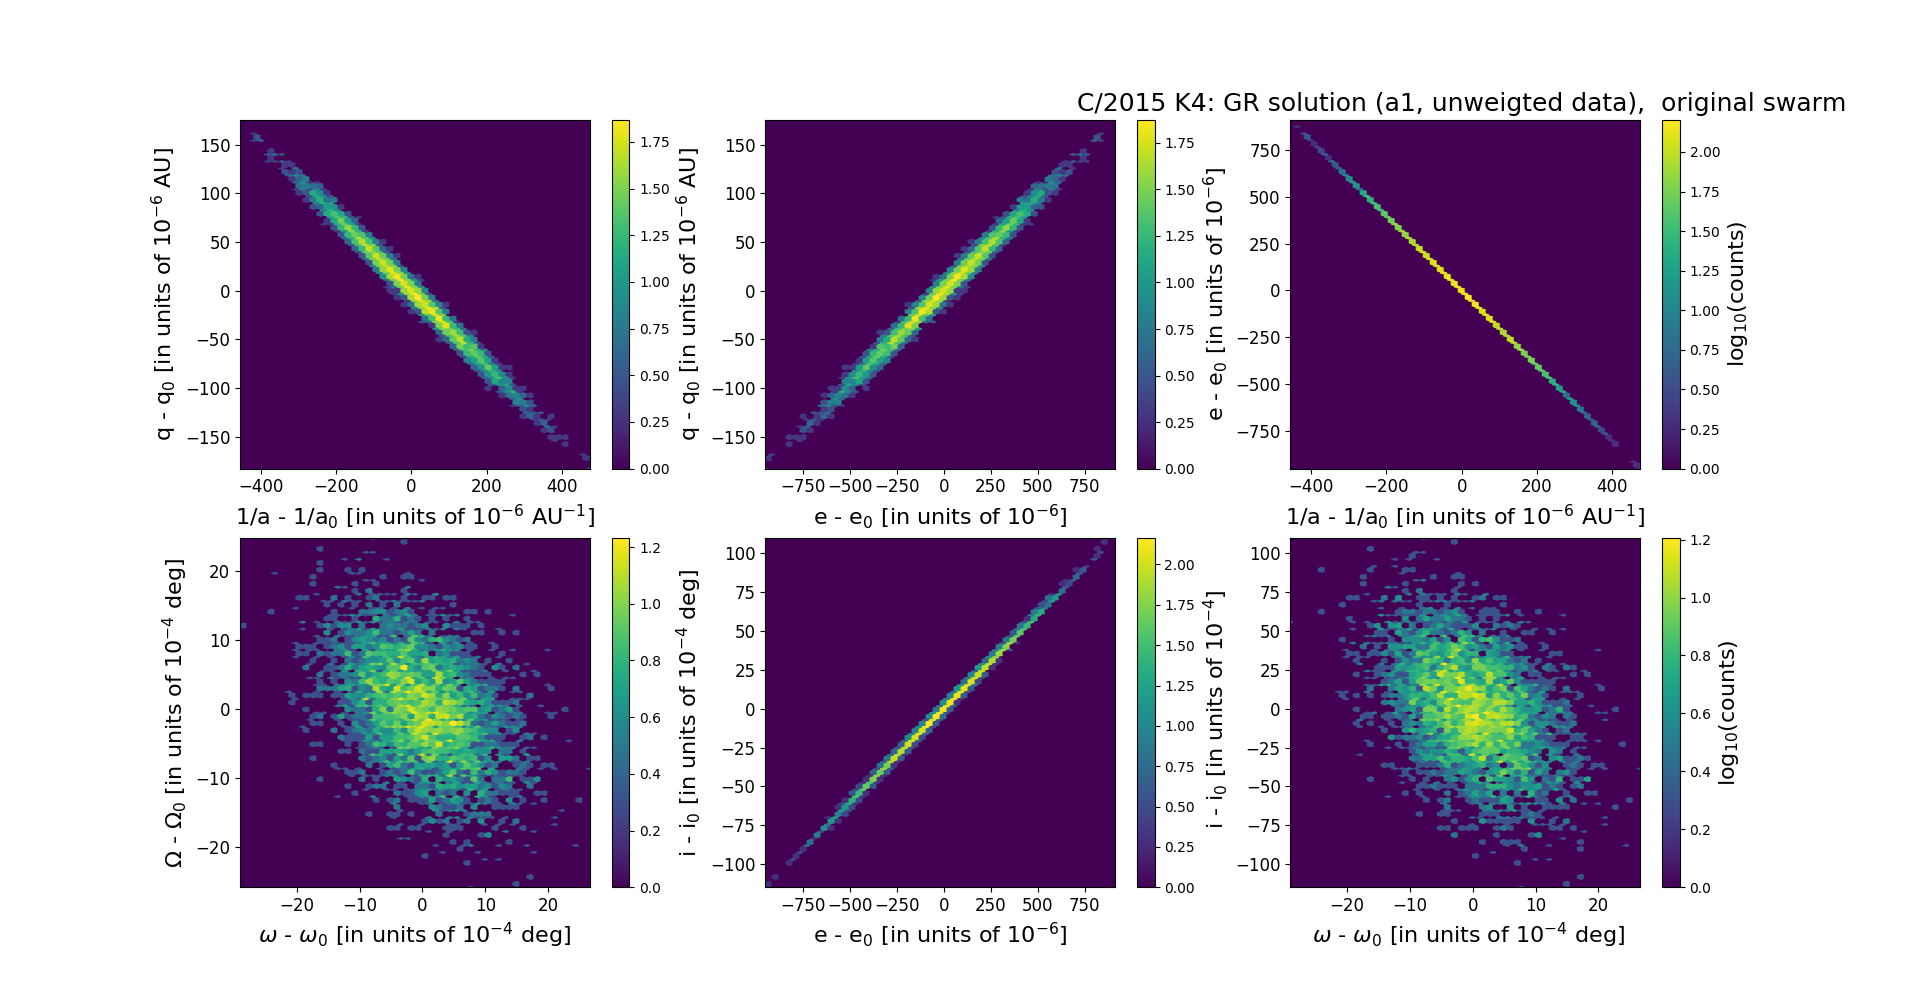
Six 2D-projections of the 6D space of original swarm including 5001 VCs. Each density map is given in logarithmic scale presented on the right in the individual panel.