C/2015 O1 PANSTARRS
more info
Comet C/2015 O1 was discovered on 19 July 2015 with Pan-STARRS 1 telescope (Haleakala), that is about months after its perihelion passage.
Some prediscovery images of this comet were found: taken on 15 and 17 of June 2015 by Space Surveillance Telescope (Atom Site).
Solutions given here are based on data spanning over 4.76 yr in a range of heliocentric distances: 8.65 au – 3.730 au (perihelion) – 7.28 au.
NG orbits using full data-arc as well as independently using pre-perihelion and post-perihelion data are determinable.
See also Królikowska and Dones 2023.
| solution description | ||
|---|---|---|
| number of observations | 4142 | |
| data interval | 2015 06 15 – 2020 03 20 | |
| data type | perihelion within the observation arc (FULL) | |
| data arc selection | entire data set (STD) | |
| range of heliocentric distances | 8.65 au – 3.73 au (perihelion) – 7.28 au | |
| type of model of motion | NI - non-gravitational orbits for water sublimation from subsolar point, asymmetric. | |
| data weighting | YES | |
| number of residuals | 8242 | |
| RMS [arcseconds] | 0.46 | |
| orbit quality class | 1a+ | |
| orbital elements (barycentric ecliptic J2000) | ||
|---|---|---|
| Epoch | 1714 10 03 | |
| perihelion date | 2018 02 18.04591120 | ± 0.00030435 |
| perihelion distance [au] | 3.72103757 | ± 0.00000340 |
| eccentricity | 0.99984809 | ± 0.00000209 |
| argument of perihelion [°] | 89.695095 | ± 0.000073 |
| ascending node [°] | 299.871696 | ± 0.000011 |
| inclination [°] | 127.176505 | ± 0.000009 |
| reciprocal semi-major axis [10-6 au-1] | 40.82 | ± 0.56 |
| file containing 5001 VCs swarm |
|---|
| 2015o1bt.bmi |
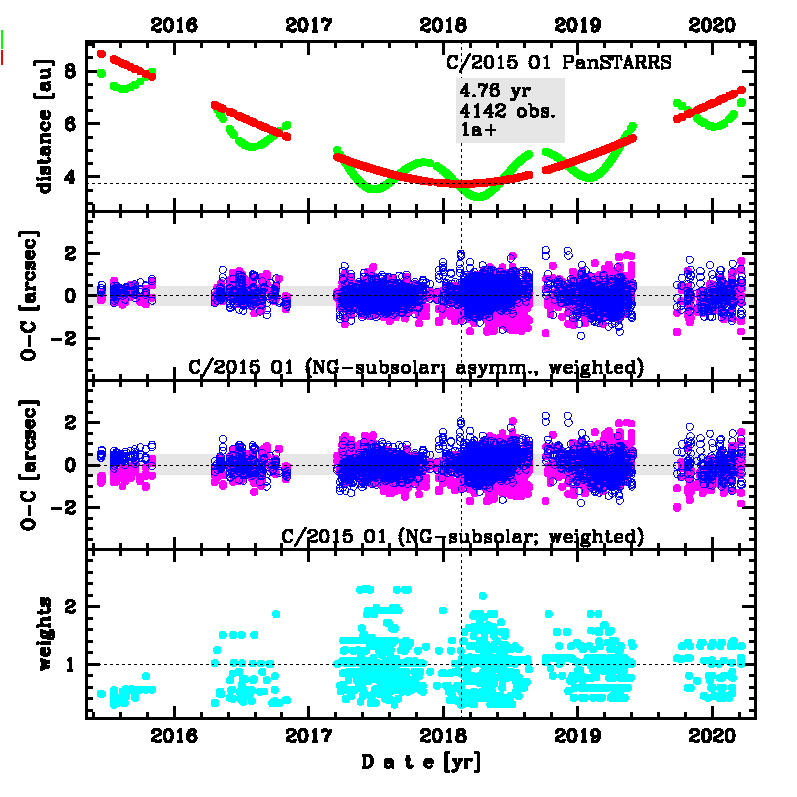
Upper panel: Time distribution of positional observations with corresponding heliocentric (red curve) and geocentric (green curve) distance at which they were taken. The horizontal dotted line shows the perihelion distance for a given comet whereas vertical dotted line — the moment of perihelion passage.
Middle panel(s): O-C diagram for a given solution (sometimes in comparison to another solution available in CODE), where residuals in right ascension are shown using magenta dots and in declination by blue open circles.
Lowest panel: Relative weights for a given data set(s).
Middle panel(s): O-C diagram for a given solution (sometimes in comparison to another solution available in CODE), where residuals in right ascension are shown using magenta dots and in declination by blue open circles.
Lowest panel: Relative weights for a given data set(s).
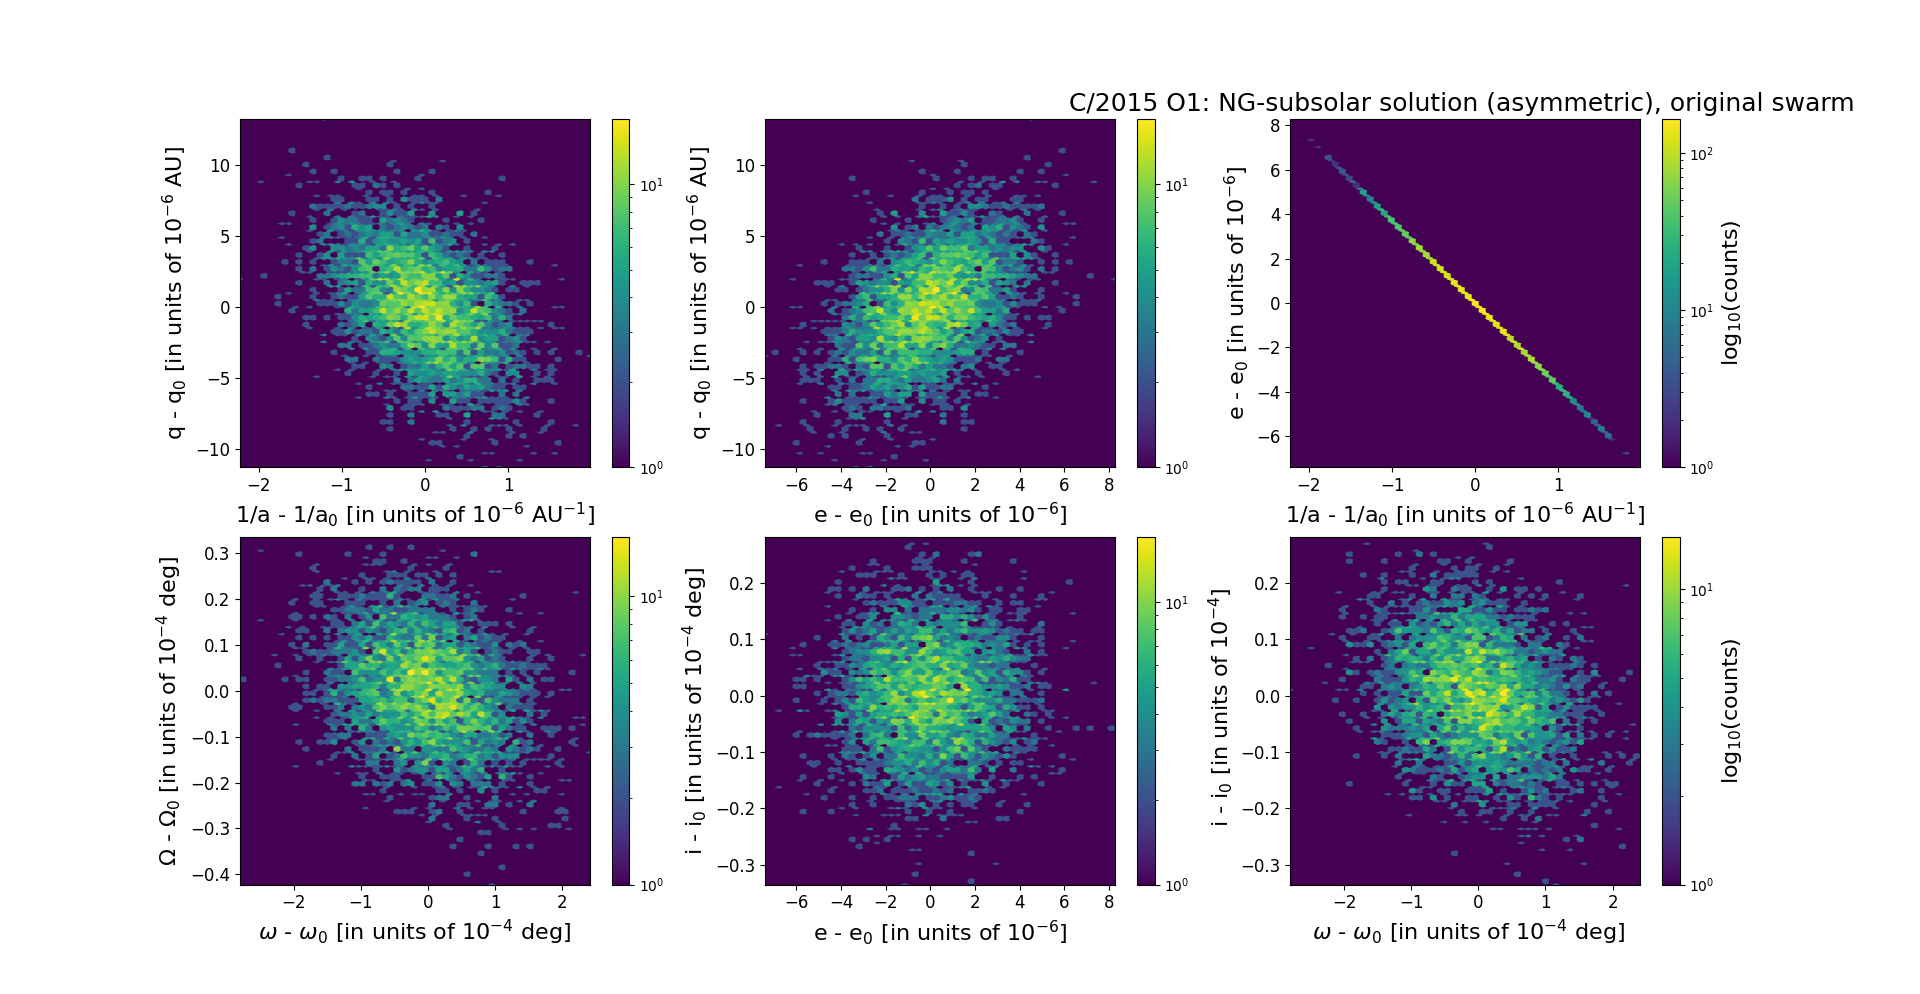
Six 2D-projections of the 6D space of original swarm including 5001 VCs. Each density map is given in logarithmic scale presented on the right in the individual panel.