C/2015 XY1 Lemmon
more info
Comet C/2015 XY1 was discovered on 4 December 2015 with Mount Lemmon survey, that is about 2.4 yr before its perihelion passage, and was observed until 1 January 2020.
Comet had its closest approach to the Earth on 27 December 2017 (6.984 au); about 4 months before its perihelion passage.
Solutions given here are based on data spanning over 4.88 yr in a range of heliocentric distances from 9.52 au 7.928 au (perihelion) – 9.62 au.
This Oort spike comet suffers slight planetary perturbations during its passage through the planetary system; however, these perturbations can lead to escape the comet from the planetary zone on a marginally hyperbolic orbit (see future barycentric orbit for solution ra).
See also Królikowska and Dones 2023.
| solution description | ||
|---|---|---|
| number of observations | 738 | |
| data interval | 2015 12 04 – 2020 01 01 | |
| data type | perihelion within the observation arc (FULL) | |
| data arc selection | entire data set (STD) | |
| range of heliocentric distances | 9.52 au – 7.93 au (perihelion) – 9.62 au | |
| detectability of NG effects in the comet's motion | NG effects not determinable | |
| type of model of motion | GR - gravitational orbit | |
| data weighting | YES | |
| number of residuals | 1439 | |
| RMS [arcseconds] | 0.51 | |
| orbit quality class | 1a+ | |
| orbital elements (barycentric ecliptic J2000) | ||
|---|---|---|
| Epoch | 2328 06 26 | |
| perihelion date | 2018 04 29.15247114 | ± 0.00084216 |
| perihelion distance [au] | 7.93304334 | ± 0.00000530 |
| eccentricity | 0.99995928 | ± 0.00000458 |
| argument of perihelion [°] | 196.285176 | ± 0.000048 |
| ascending node [°] | 281.608952 | ± 0.000010 |
| inclination [°] | 148.828177 | ± 0.00001 |
| reciprocal semi-major axis [10-6 au-1] | 5.13 | ± 0.58 |
| file containing 5001 VCs swarm |
|---|
| 2015xyba.bpl |
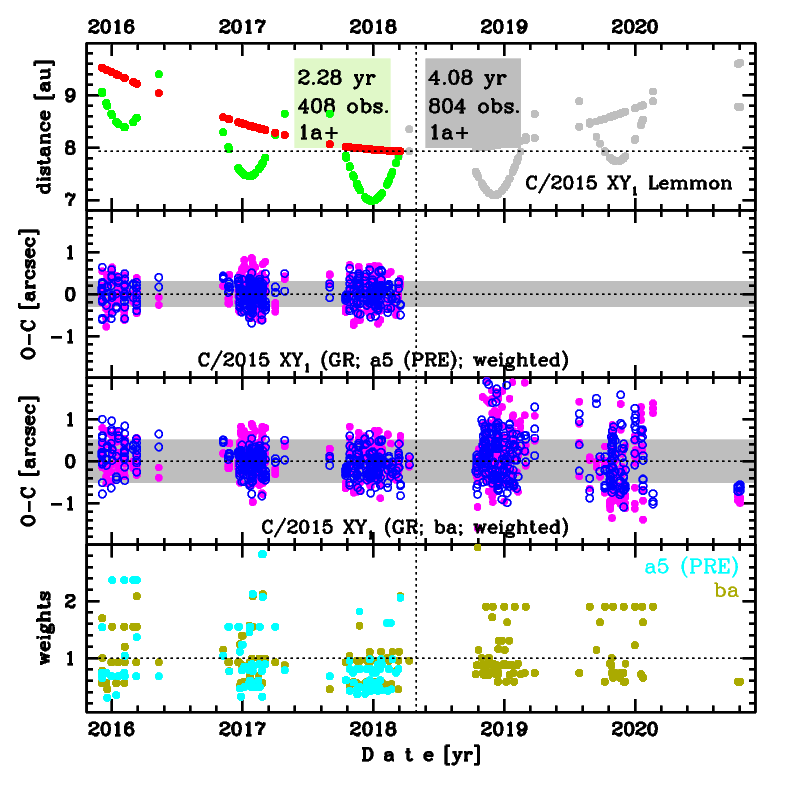
Upper panel: Time distribution of positional observations with corresponding heliocentric (red curve) and geocentric (green curve) distance at which they were taken. The horizontal dotted line shows the perihelion distance for a given comet whereas vertical dotted line — the moment of perihelion passage.
Middle panel(s): O-C diagram for a given solution (sometimes in comparison to another solution available in CODE), where residuals in right ascension are shown using magenta dots and in declination by blue open circles.
Lowest panel: Relative weights for a given data set(s).
Middle panel(s): O-C diagram for a given solution (sometimes in comparison to another solution available in CODE), where residuals in right ascension are shown using magenta dots and in declination by blue open circles.
Lowest panel: Relative weights for a given data set(s).
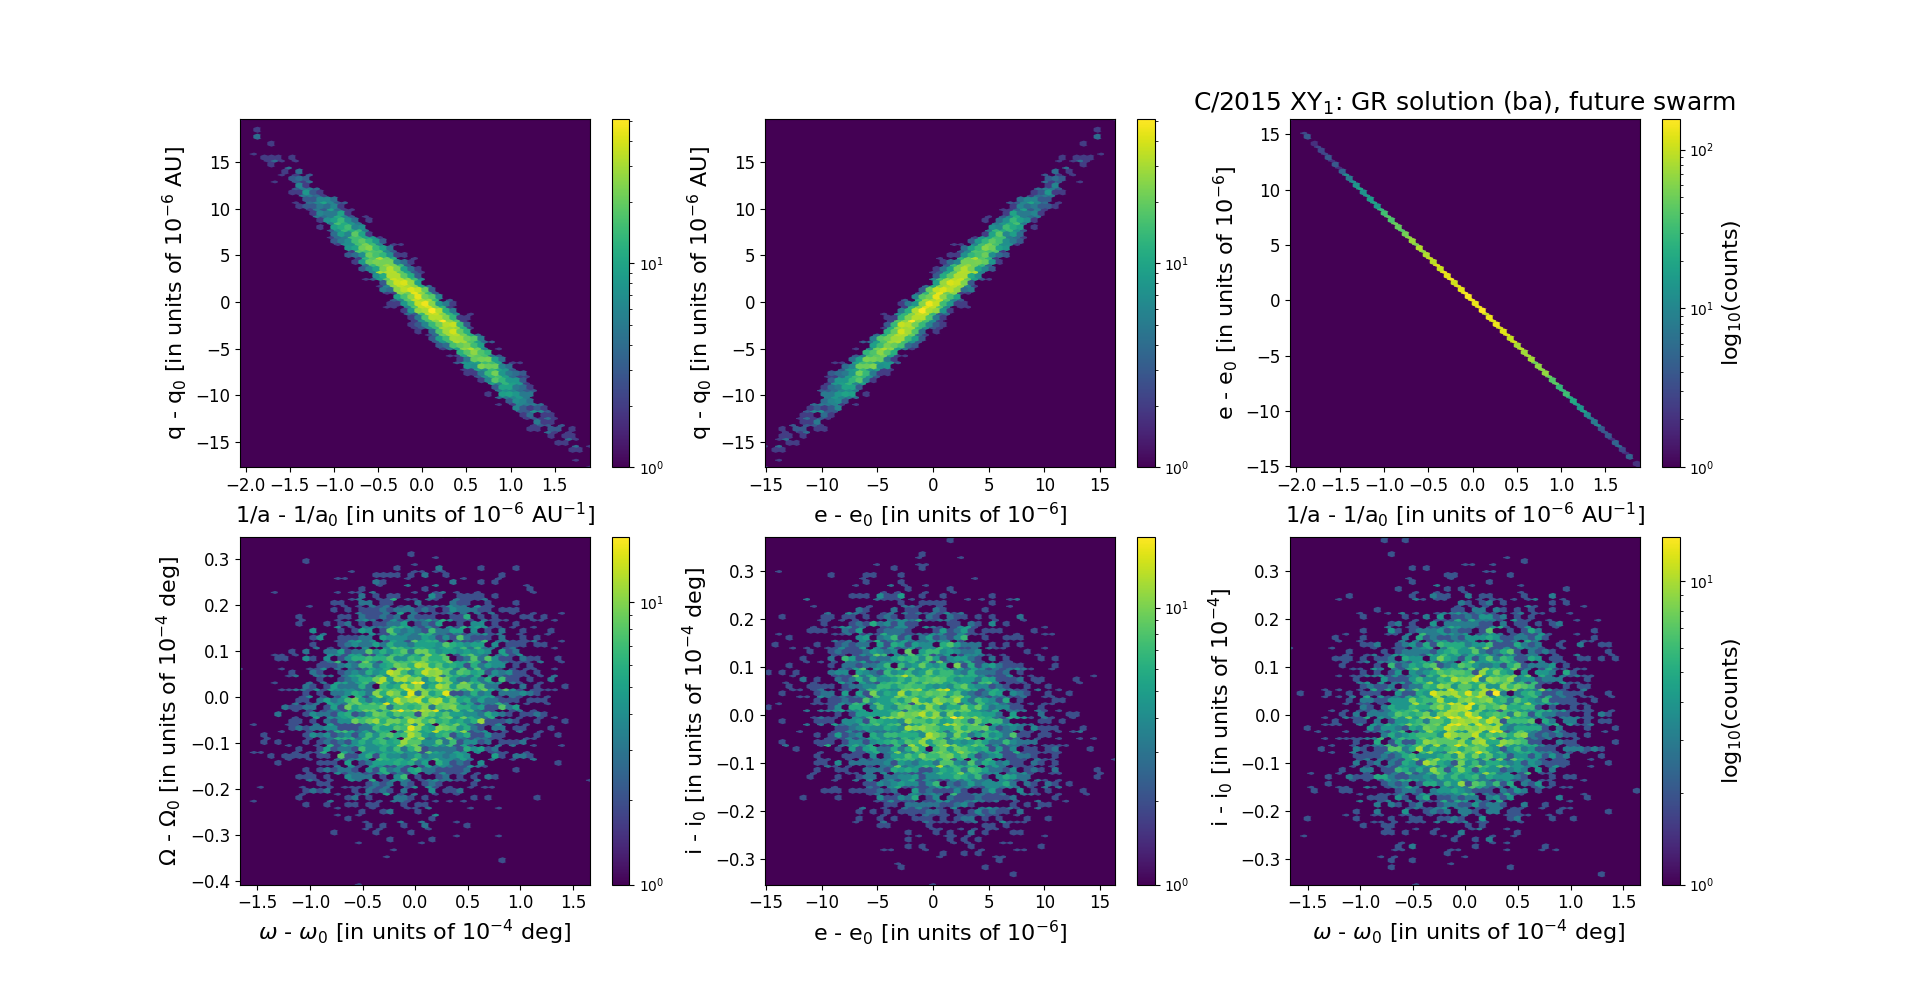
Six 2D-projections of the 6D space of future swarm including 5001 VCs. Each density map is given in logarithmic scale presented on the right in the individual panel.