C/2016 U1 NEOWISE
more info
Comet C/2016 U1 was discovered on 21 October 2016 by Near-Earth Object Wide-field Infrared Survey Explorer, that is less than 3 months before its perihelion passage, and was astrometrically observed until 12 January 2017. Comet had closest approach to the Earth on 13 December 2016 (0.709 au, about a month before the perihelion passage).
Sekanina (2019) concluded that this comet was a rare example of a comet that survived its perihelion passage despite a small distance from the Sun at that moment (see his Tables 2 and 6).
Despite short data arc this is a comet with NG effects determinable using positional data fitting. Both solutions (GR and NG) are based on data spanning over 0.227 yr in the pre-perihelion orbital leg, in a range of heliocentric distances from 1.86 au to 0.321 au.
GR assumption gives original hyperbolic orbit; however, NG orbit results in original semimajor axis of about 1900–3300 au (uncertainty of one sigma is used). C/2016 K1 suffers moderate/large planetary perturbations while passing through the planetary system; these perturbations probably lead to escape the comet from the planetary zone on a hyperbolic orbit (see future barycentric orbits).
| solution description | ||
|---|---|---|
| number of observations | 382 | |
| data interval | 2016 10 21 – 2017 01 12 | |
| data type | observed only before perihelion (PRE) | |
| data arc selection | entire data set (STD) | |
| range of heliocentric distances | 1.86 au – 0.321au | |
| type of model of motion | NS - non-gravitational orbits for standard g(r) | |
| data weighting | YES | |
| number of residuals | 757 | |
| RMS [arcseconds] | 0.80 | |
| orbit quality class | 2b | |
| next orbit statistics, both Galactic and stellar perturbations were taken into account | ||
|---|---|---|
| no. of returning VCs in the swarm | 0 | |
| no. of escaping VCs in the swarm | 5001 | |
| no. of hyperbolas among escaping VCs in the swarm | 5001 | * |
| next reciprocal semi-major axis [10-6 au-1] | -981.07 – -854.70 – -732.88 | |
| next perihelion distance [au] | 1.5 – 1.8 – 2 | |
| synchronous stop epoch [Myr] | 0.536 | S |
| percentage of VCs with qnext < 10 | 100 | |
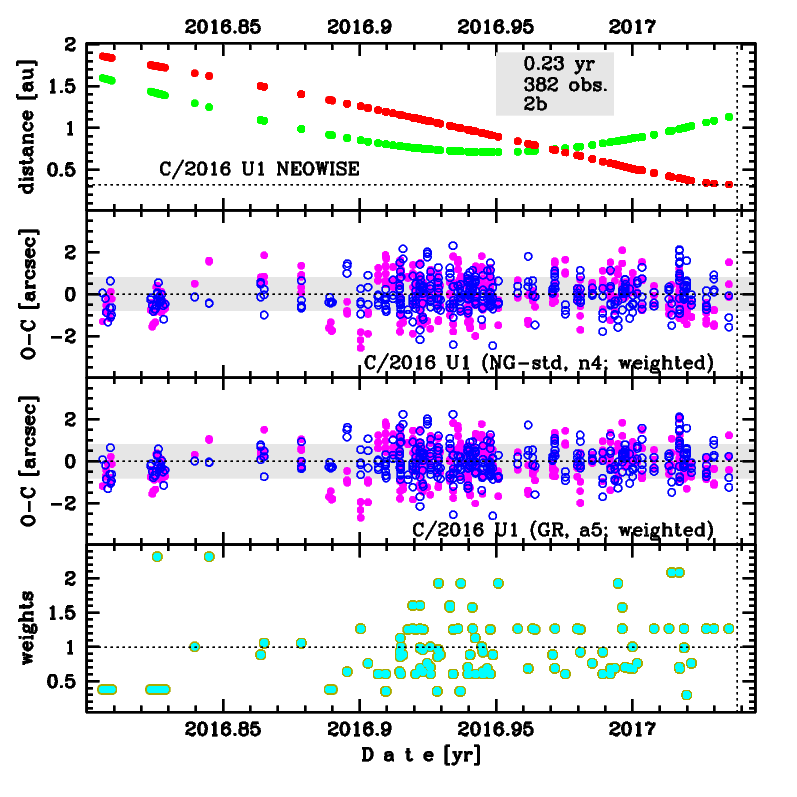
Upper panel: Time distribution of positional observations with corresponding heliocentric (red curve) and geocentric (green curve) distance at which they were taken. The horizontal dotted line shows the perihelion distance for a given comet whereas vertical dotted line — the moment of perihelion passage.
Middle panel(s): O-C diagram for a given solution (sometimes in comparison to another solution available in CODE), where residuals in right ascension are shown using magenta dots and in declination by blue open circles.
Lowest panel: Relative weights for a given data set(s).
Middle panel(s): O-C diagram for a given solution (sometimes in comparison to another solution available in CODE), where residuals in right ascension are shown using magenta dots and in declination by blue open circles.
Lowest panel: Relative weights for a given data set(s).
| next_g orbit statistics, here only the Galactic tide has been included | ||
|---|---|---|
| no. of returning VCs in the swarm | 0 | |
| no. of escaping VCs in the swarm | 5001 | |
| no. of hyperbolas among escaping VCs in the swarm | 5001 | * |
| next reciprocal semi-major axis [10-6 au-1] | -981.10 – -854.73 – -732.90 | |
| next perihelion distance [au] | 1.7 – 2 – 2.3 | |
| synchronous stop epoch [Myr] | 0.56 | S |
| percentage of VCs with qnext < 10 | 100 | |