C/2017 F1 Lemmon
more info
Comet C/2017 F1 was discovered on 20 March 2017 with Mount Lemmon survey, that is about 8.5 months before its perihelion passage. Later single pre-discovery obsebation was found from 4 February 2017. This comet was rather rarely observed until 18 March 2018.
Comet had its closest approach to the Earth on 24 December 2017 (3.480 au), less than a month after its perihelion passage.
The preferred solution given here is based on data spanning over 1.12 yr in a range of heliocentric distances: 5.10 au – 4.50 au (perihelion) – 4.58 au.
This Oort spike comet suffers moderate planetary perturbations during its passage through the planetary system; these perturbations lead to escape the comet from the planetary zone on a hyperbolic orbit (see future barycentric orbits).
| solution description | ||
|---|---|---|
| number of observations | 84 | |
| data interval | 2017 03 20 – 2018 02 17 | |
| data type | perihelion within the observation arc (FULL) | |
| data arc selection | entire data set (STD) | |
| range of heliocentric distances | 4.95 au – 4.50 au (perihelion) – 4.54 au | |
| detectability of NG effects in the comet's motion | NG effects not determinable | |
| type of model of motion | GR - gravitational orbit | |
| data weighting | NO | |
| number of residuals | 155 | |
| RMS [arcseconds] | 0.41 | |
| orbit quality class | 1b | |
| previous orbit statistics, both Galactic and stellar perturbations were taken into account | ||
|---|---|---|
| no. of returning VCs in the swarm | 4970 | * |
| no. of escaping VCs in the swarm | 31 | |
| no. of hyperbolas among escaping VCs in the swarm | 0 | |
| previous reciprocal semi-major axis [10-6 au-1] | 21.99 – 28.77 – 35.29 | R |
| previous perihelion distance [au] | 1300 – 2000 – 3100 | R |
| previous aphelion distance [103 au] | 55 – 68 – 88 | R |
| time interval to previous perihelion [Myr] | 4.6 – 6.3 – 9.4 | R |
| percentage of VCs with qprev > 20 | 100 | |
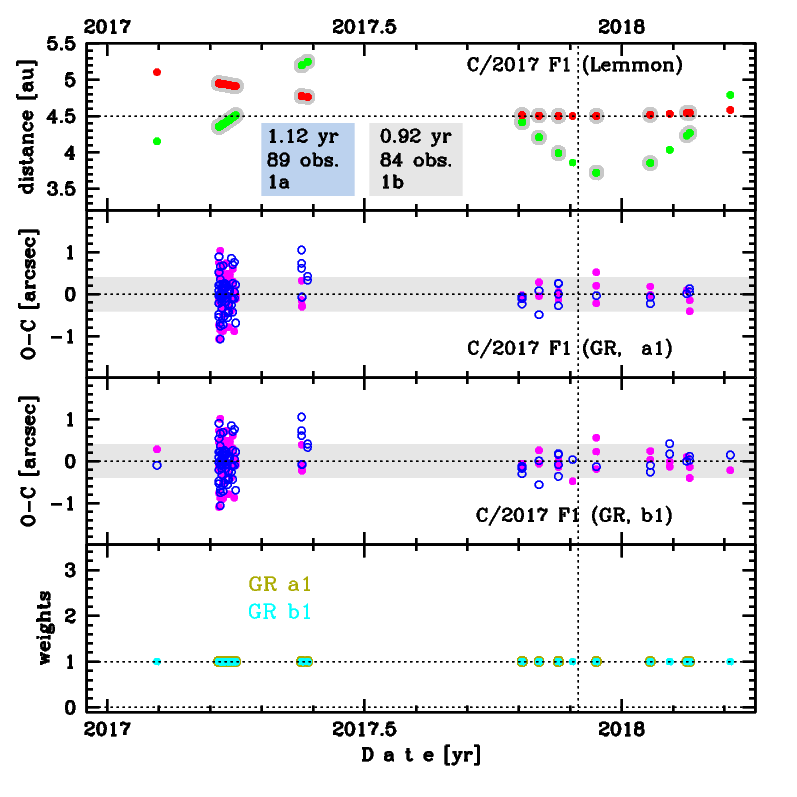
Upper panel: Time distribution of positional observations with corresponding heliocentric (red curve) and geocentric (green curve) distance at which they were taken. The horizontal dotted line shows the perihelion distance for a given comet whereas vertical dotted line — the moment of perihelion passage.
Middle panel(s): O-C diagram for a given solution (sometimes in comparison to another solution available in CODE), where residuals in right ascension are shown using magenta dots and in declination by blue open circles.
Lowest panel: Relative weights for a given data set(s).
Middle panel(s): O-C diagram for a given solution (sometimes in comparison to another solution available in CODE), where residuals in right ascension are shown using magenta dots and in declination by blue open circles.
Lowest panel: Relative weights for a given data set(s).
| previous_g orbit statistics, here only the Galactic tide has been included | ||
|---|---|---|
| no. of returning VCs in the swarm | 4945 | * |
| no. of escaping VCs in the swarm | 56 | |
| no. of hyperbolas among escaping VCs in the swarm | 0 | |
| previous reciprocal semi-major axis [10-6 au-1] | 22.06 – 28.92 – 35.99 | R |
| previous perihelion distance [au] | 3.9 – 15 – 110 | R |
| previous aphelion distance [103 au] | 56 – 69 – 91 | R |
| time interval to previous perihelion [Myr] | 4.6 – 6.4 – 9.6 | R |
| percentage of VCs with qprev < 10 | 38 | |
| percentage of VCs with 10 < qprev < 20 | 19 | |
| percentage of VCs with qprev > 20 | 43 | |