C/2017 K2 PANSTARRS
more info
Comet C/2017 K2 was discovered on 21 May 2017 by the Panoramic Survey Telescope and Rapid Response System (Pan-STARRS) in Hawaii when it was 16.1 au from the Sun. Later, almost twenty pre-discovery measurements dating back to 2013 May 12 were found, the first series of measurements was taken at the heliocentric distance of almost 24 au. These prediscovery data series are separated by one large gap
of about 2.5 yr and two shorter gaps of about six months and eight months, respectively. Since the discovery the comet has been observed almost continuously (and is still observable).
Comet will have its closest approach to the Earth on 14 July 2022 (1.81 au), about 5 months before its perihelion passage (1.80 au from the Sun on 19 December 2022).
Solutions given here are based on pre-perihelion data and different data-arcs, for more see respective solutions; the longest data arc is spanning over 8.90 yr in a range of heliocentric distances from 23.74 au to 3.52 au (7 April 2022)
More details in Królikowska and Dybczyński 2018 and Dybczyński and Królikowska 2022 (or Dybczyński and Królikowska 2022).
| solution description | ||
|---|---|---|
| number of observations | 996 | |
| data interval | 2013 05 12 – 2018 10 13 | |
| data arc selection | data generally limited to pre-perihelion (PRE) | |
| range of heliocentric distances | 23.74 au – 13.04au | |
| detectability of NG effects in the comet's motion | comet with determinable NG~orbit | |
| type of model of motion | GR - gravitational orbit | |
| data weighting | YES | |
| number of residuals | 1969 | |
| RMS [arcseconds] | 0.30 | |
| orbit quality class | 1a+ | |
| orbital elements (barycentric ecliptic J2000) | ||
|---|---|---|
| Epoch | 1722 12 20 | |
| perihelion date | 2022 12 18.80685154 | ± 0.00989916 |
| perihelion distance [au] | 1.79561418 | ± 0.00001007 |
| eccentricity | 0.99993627 | ± 0.00000417 |
| argument of perihelion [°] | 236.211209 | ± 0.000380 |
| ascending node [°] | 88.086586 | ± 0.000110 |
| inclination [°] | 87.57315 | ± 0.000014 |
| reciprocal semi-major axis [10-6 au-1] | 35.49 | ± 2.33 |
| file containing 5001 VCs swarm |
|---|
| 2017k2a9.bmi |
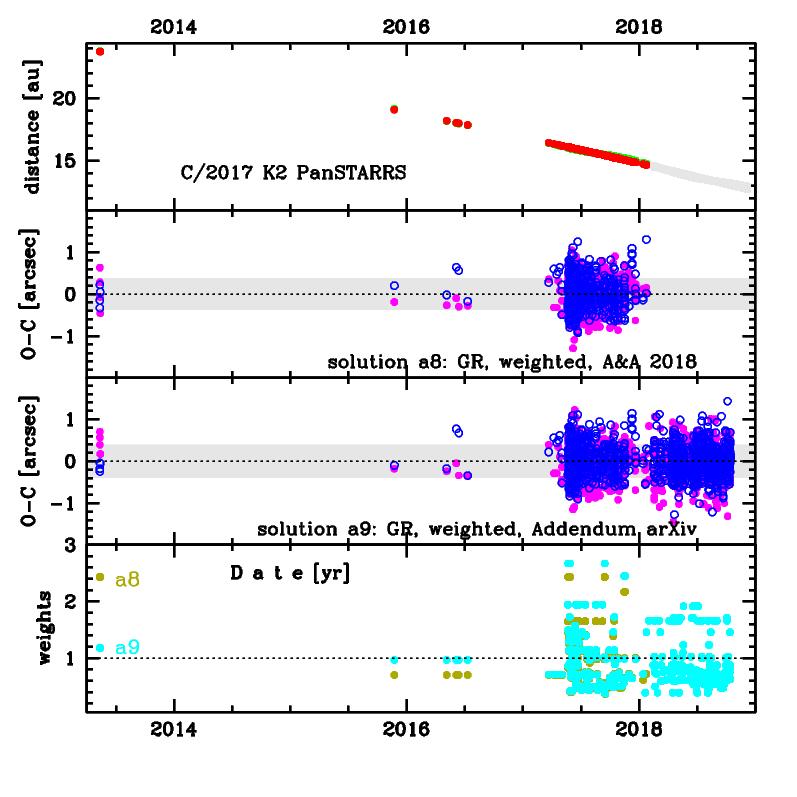
Upper panel: Time distribution of positional observations with corresponding heliocentric (red curve) and geocentric (green curve) distance at which they were taken. The horizontal dotted line shows the perihelion distance for a given comet whereas vertical dotted line — the moment of perihelion passage.
Middle panel(s): O-C diagram for a given solution (sometimes in comparison to another solution available in CODE), where residuals in right ascension are shown using magenta dots and in declination by blue open circles.
Lowest panel: Relative weights for a given data set(s).
Middle panel(s): O-C diagram for a given solution (sometimes in comparison to another solution available in CODE), where residuals in right ascension are shown using magenta dots and in declination by blue open circles.
Lowest panel: Relative weights for a given data set(s).
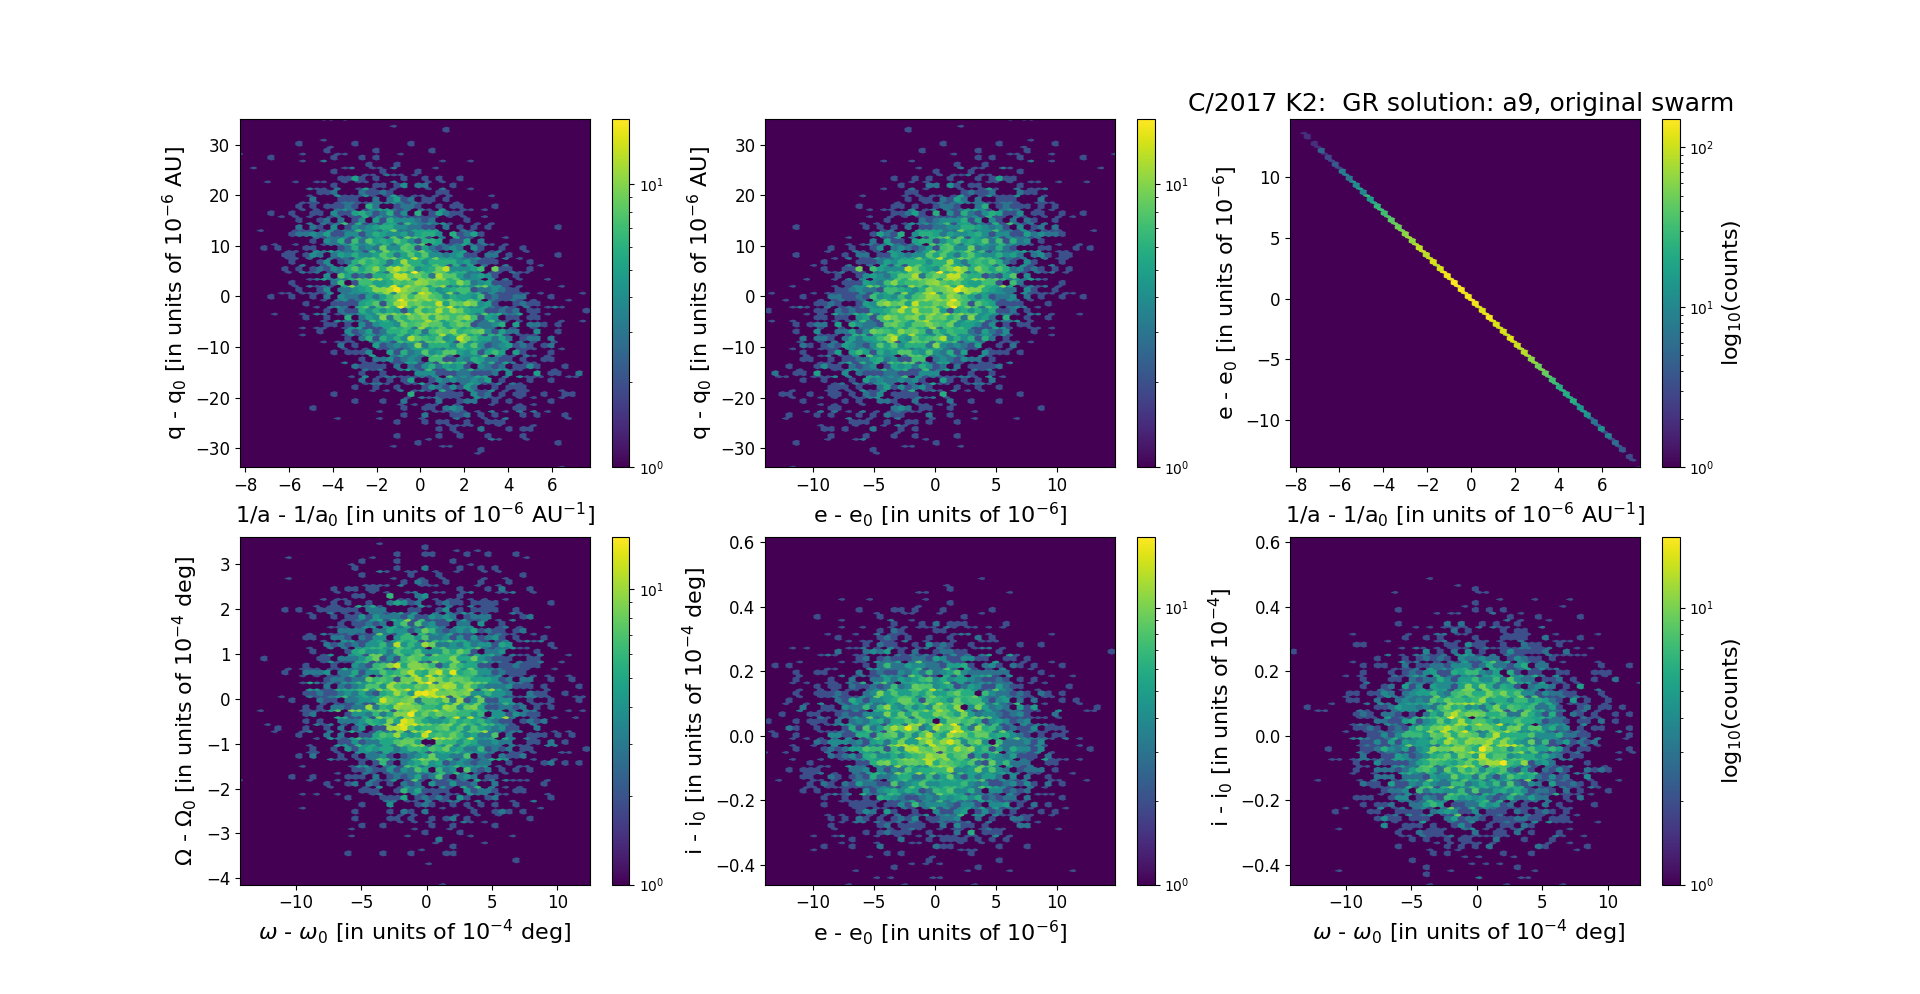
Six 2D-projections of the 6D space of original swarm including 5001 VCs. Each density map is given in logarithmic scale presented on the right in the individual panel.