C/2017 K2 PANSTARRS
more info
Comet C/2017 K2 was discovered on 21 May 2017 by the Panoramic Survey Telescope and Rapid Response System (Pan-STARRS) in Hawaii when it was 16.1 au from the Sun. Later, almost twenty pre-discovery measurements dating back to 2013 May 12 were found, the first series of measurements was taken at the heliocentric distance of almost 24 au. These prediscovery data series are separated by one large gap
of about 2.5 yr and two shorter gaps of about six months and eight months, respectively. Since the discovery the comet has been observed almost continuously (and is still observable).
Comet will have its closest approach to the Earth on 14 July 2022 (1.81 au), about 5 months before its perihelion passage (1.80 au from the Sun on 19 December 2022).
Solutions given here are based on pre-perihelion data and different data-arcs, for more see respective solutions; the longest data arc is spanning over 8.90 yr in a range of heliocentric distances from 23.74 au to 3.52 au (7 April 2022)
More details in Królikowska and Dybczyński 2018 and Dybczyński and Królikowska 2022 (or Dybczyński and Królikowska 2022).
| solution description | ||
|---|---|---|
| number of observations | 7735 | |
| data interval | 2013 05 12 – 2022 04 07 | |
| data type | observed only before perihelion (PRE) | |
| data arc selection | entire data set (STD) | |
| range of heliocentric distances | 23.74 au – 3.52au | |
| type of model of motion | NH - non-gravitational orbits for water sublimation from subsolar point | |
| data weighting | YES | |
| number of residuals | 15166 | |
| RMS [arcseconds] | 0.34 | |
| orbit quality class | 1a+ | |
| previous orbit statistics, both Galactic and stellar perturbations were taken into account | ||
|---|---|---|
| no. of returning VCs in the swarm | 5001 | * |
| no. of escaping VCs in the swarm | 0 | |
| no. of hyperbolas among escaping VCs in the swarm | 0 | |
| previous reciprocal semi-major axis [10-6 au-1] | 45.14 – 45.44 – 45.74 | |
| previous perihelion distance [au] | 295 – 303 – 312 | |
| previous aphelion distance [103 au] | 43.43 – 43.71 – 44 | |
| time interval to previous perihelion [Myr] | 3.399 – 3.43 – 3.462 | |
| percentage of VCs with qprev > 20 | 100 | |
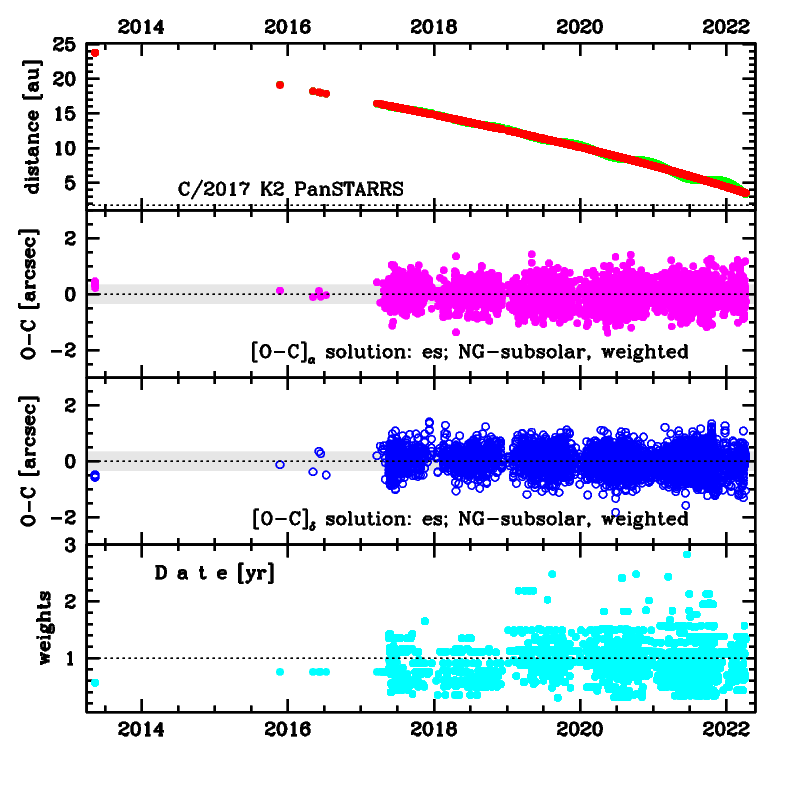
Upper panel: Time distribution of positional observations with corresponding heliocentric (red curve) and geocentric (green curve) distance at which they were taken. The horizontal dotted line shows the perihelion distance for a given comet whereas vertical dotted line — the moment of perihelion passage.
Middle panel(s): O-C diagram for a given solution (sometimes in comparison to another solution available in CODE), where residuals in right ascension are shown using magenta dots and in declination by blue open circles.
Lowest panel: Relative weights for a given data set(s).
Middle panel(s): O-C diagram for a given solution (sometimes in comparison to another solution available in CODE), where residuals in right ascension are shown using magenta dots and in declination by blue open circles.
Lowest panel: Relative weights for a given data set(s).
| previous_g orbit statistics, here only the Galactic tide has been included | ||
|---|---|---|
| no. of returning VCs in the swarm | 5001 | * |
| no. of escaping VCs in the swarm | 0 | |
| no. of hyperbolas among escaping VCs in the swarm | 0 | |
| previous reciprocal semi-major axis [10-6 au-1] | 44.03 – 44.28 – 44.53 | |
| previous perihelion distance [au] | 5 – 5.09 – 5.18 | |
| previous aphelion distance [103 au] | 44.91 – 45.16 – 45.42 | |
| time interval to previous perihelion [Myr] | 3.353 – 3.381 – 3.411 | |
| percentage of VCs with qprev < 10 | 100 | |