C/2017 K5 PANSTARRS
more info
Comet C/2017 K5 was discovered on 27 May 2017 with Pan-STARRS 1 telescope (Haleakala), that is almost 3 years before its perihelion passage. This comet was observed until 9 July 2020.
Comet will have its closest approach to the Earth on 2 July 2020 (6.688 au), a bit more than a 3 months after its perihelion passage.
The preferred solution given here is based on pre-perihelion data spanning over 3.12 yr in a range of heliocentric distances from 9.90 au – 7.68 au (perihelion) – 7.71 au.
This Oort spike comet suffers small planetary perturbations during its passage through the planetary system that likely lead to escape the comet from the planetary zone on a hyperbolic orbit (see future barycentric orbits).
| solution description | ||
|---|---|---|
| number of observations | 25 | |
| data interval | 2017 05 27 – 2018 05 12 | |
| data arc selection | data generally limited to pre-perihelion (PRE) | |
| range of heliocentric distances | 9.9 au – 8.74au | |
| detectability of NG effects in the comet's motion | NG effects not determinable | |
| type of model of motion | GR - gravitational orbit | |
| data weighting | NO | |
| number of residuals | 50 | |
| RMS [arcseconds] | 0.35 | |
| orbit quality class | 1b | |
| orbital elements (barycentric ecliptic J2000) | ||
|---|---|---|
| Epoch | 2327 09 20 | |
| perihelion date | 2020 03 25.01929677 | ± 0.02773379 |
| perihelion distance [au] | 7.66728055 | ± 0.00033259 |
| eccentricity | 1.00146158 | ± 0.00007701 |
| argument of perihelion [°] | 171.831802 | ± 0.004068 |
| ascending node [°] | 102.349267 | ± 0.000341 |
| inclination [°] | 82.280777 | ± 0.000181 |
| reciprocal semi-major axis [10-6 au-1] | -190.62 | ± 10.05 |
| file containing 5001 VCs swarm |
|---|
| 2017k5a1.bpl |
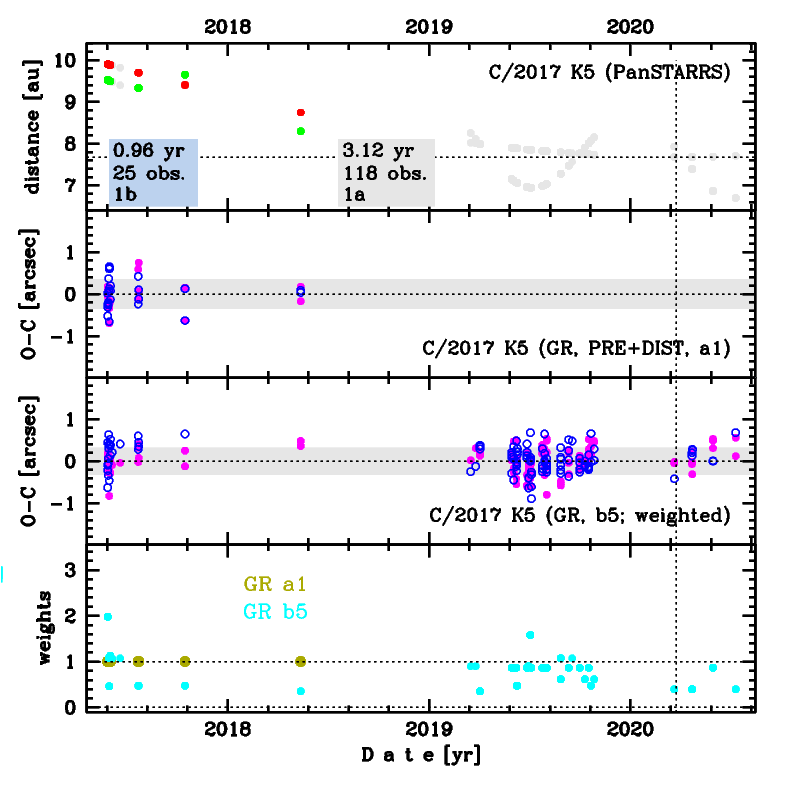
Upper panel: Time distribution of positional observations with corresponding heliocentric (red curve) and geocentric (green curve) distance at which they were taken. The horizontal dotted line shows the perihelion distance for a given comet whereas vertical dotted line — the moment of perihelion passage.
Middle panel(s): O-C diagram for a given solution (sometimes in comparison to another solution available in CODE), where residuals in right ascension are shown using magenta dots and in declination by blue open circles.
Lowest panel: Relative weights for a given data set(s).
Middle panel(s): O-C diagram for a given solution (sometimes in comparison to another solution available in CODE), where residuals in right ascension are shown using magenta dots and in declination by blue open circles.
Lowest panel: Relative weights for a given data set(s).
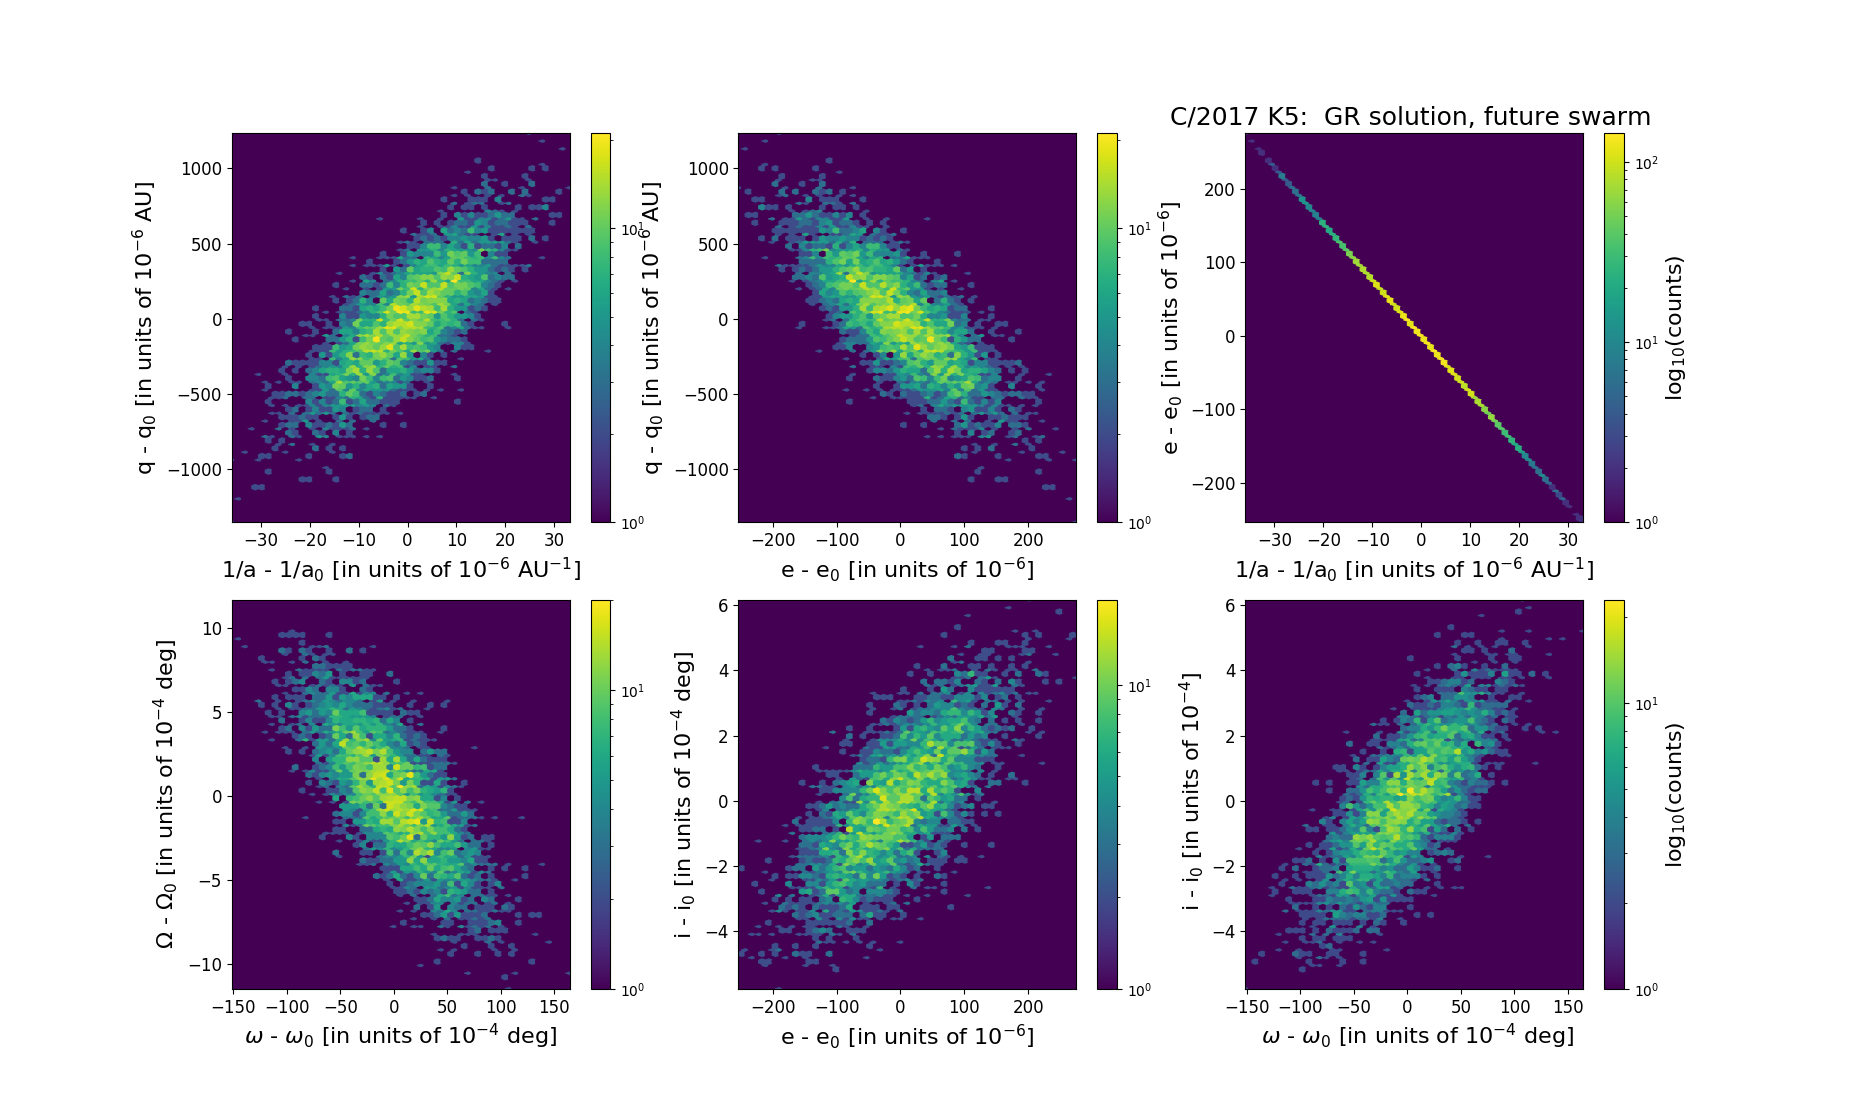
Six 2D-projections of the 6D space of future swarm including 5001 VCs. Each density map is given in logarithmic scale presented on the right in the individual panel.