C/2017 M4 ATLAS
more info
Comet C/2017 M4 was discovered on 21 June 2017 by Asteroid Terrestrial-impact Last Alert System (ATLAS) Team, that is about a year and 7 months before its perihelion passage. Some prediscovery images of this comet were found: taken on 16 June 2017 by Pan-STARRS 1 telescope (Haleakala).
Solutions given here are based on data spanning over 4.46 yr in a range of heliocentric distances: 6.09 au – 3.252 au (perihelion) – 9.19 au.
NG orbits using full data-arc as well as independently using pre-perihelion and post-perihelion data are determinable.
See also Królikowska and Dones 2023.
| solution description | ||
|---|---|---|
| number of observations | 3284 | |
| data interval | 2017 06 16 – 2021 11 30 | |
| data type | perihelion within the observation arc (FULL) | |
| data arc selection | entire data set (STD) | |
| range of heliocentric distances | 6.09 au – 3.25 au (perihelion) – 9.19 au | |
| detectability of NG effects in the comet's motion | comet with NG effects strongly manifested in positional data fitting | |
| type of model of motion | GR - gravitational orbit | |
| data weighting | YES | |
| number of residuals | 6492 | |
| RMS [arcseconds] | 0.88 | |
| orbit quality class | 1a+ | |
| next orbit statistics, both Galactic and stellar perturbations were taken into account | ||
|---|---|---|
| no. of returning VCs in the swarm | 5001 | * |
| no. of escaping VCs in the swarm | 0 | |
| no. of hyperbolas among escaping VCs in the swarm | 0 | |
| next reciprocal semi-major axis [10-6 au-1] | 100.79 – 101.27 – 101.76 | |
| next perihelion distance [au] | 3.3142 – 3.3156 – 3.317 | |
| next aphelion distance [103 au] | 19.65 – 19.75 – 19.84 | |
| time interval to next perihelion [Myr] | 0.9733 – 0.9803 – 0.9873 | |
| percentage of VCs with qnext < 10 | 100 | |
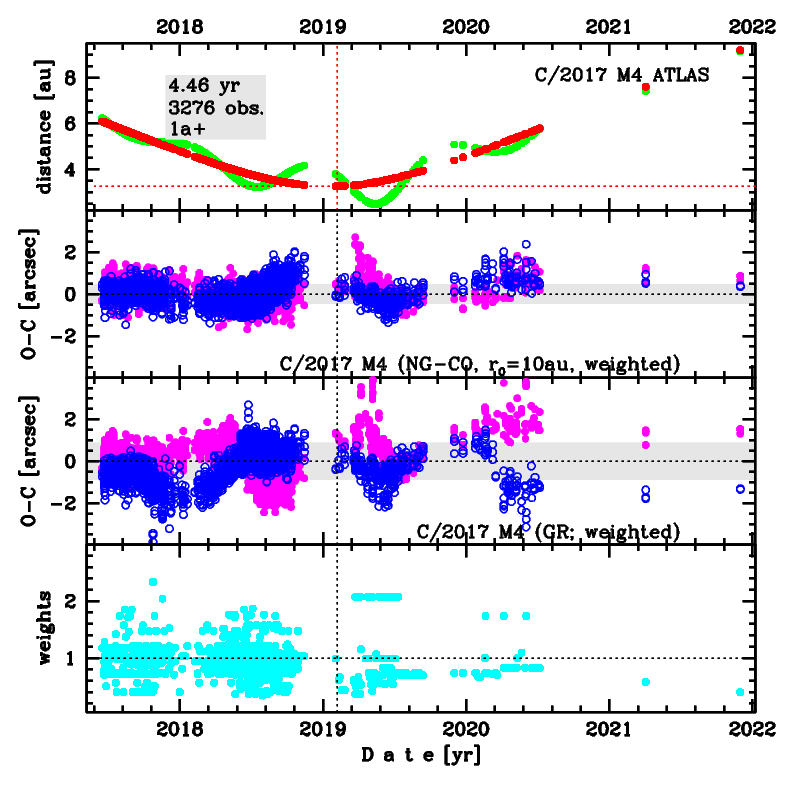
Upper panel: Time distribution of positional observations with corresponding heliocentric (red curve) and geocentric (green curve) distance at which they were taken. The horizontal dotted line shows the perihelion distance for a given comet whereas vertical dotted line — the moment of perihelion passage.
Middle panel(s): O-C diagram for a given solution (sometimes in comparison to another solution available in CODE), where residuals in right ascension are shown using magenta dots and in declination by blue open circles.
Lowest panel: Relative weights for a given data set(s).
Middle panel(s): O-C diagram for a given solution (sometimes in comparison to another solution available in CODE), where residuals in right ascension are shown using magenta dots and in declination by blue open circles.
Lowest panel: Relative weights for a given data set(s).
| next_g orbit statistics, here only the Galactic tide has been included | ||
|---|---|---|
| no. of returning VCs in the swarm | 5001 | * |
| no. of escaping VCs in the swarm | 0 | |
| no. of hyperbolas among escaping VCs in the swarm | 0 | |
| next reciprocal semi-major axis [10-6 au-1] | 100.77 – 101.25 – 101.73 | |
| next perihelion distance [au] | 3.3147 – 3.316 – 3.3173 | |
| next aphelion distance [103 au] | 19.66 – 19.75 – 19.84 | |
| time interval to next perihelion [Myr] | 0.9736 – 0.9807 – 0.9877 | |
| percentage of VCs with qnext < 10 | 100 | |