C/2018 W2 Africano
more info
Comet C/2018 W2 was discovered on 27 November 2018, about ten months before its perihelion passage, and was last seen on 15 June 2020.
Comet had its closest approach to the Earth on 27 September 2019 (0.494 au), about three weeks after its perihelion passage.
The preferred NG solution given here span over 1.55 yr in a range of heliocentric distances: 3.81 au – 1.46 au (perihelion) – 3.83 au; also orbit based on pre-perihelion data is presented.
This long-period comet of original semimajor axis of about 2,000 au suffers moderate planetary perturbations during its passage through the planetary system and these perturbations lead to escape the comet from the planetary zone on a hyperbolic orbit (see future barycentric orbits).
| solution description | ||
|---|---|---|
| number of observations | 2028 | |
| data interval | 2018 11 27 – 2020 06 15 | |
| data type | perihelion within the observation arc (FULL) | |
| data arc selection | entire data set (STD) | |
| range of heliocentric distances | 3.81 au – 1.46 au (perihelion) – 3.83 au | |
| type of model of motion | NS - non-gravitational orbits for standard g(r) | |
| data weighting | YES | |
| number of residuals | 3974 | |
| RMS [arcseconds] | 0.35 | |
| orbit quality class | 1a | |
| next orbit statistics, both Galactic and stellar perturbations were taken into account | ||
|---|---|---|
| no. of returning VCs in the swarm | 0 | |
| no. of escaping VCs in the swarm | 5001 | |
| no. of hyperbolas among escaping VCs in the swarm | 5001 | * |
| next reciprocal semi-major axis [10-6 au-1] | -250.18 – -247.62 – -244.93 | |
| next perihelion distance [au] | 0.033 – 0.037 – 0.041 | |
| synchronous stop epoch [Myr] | 1.08 | S |
| percentage of VCs with qnext < 10 | 100 | |
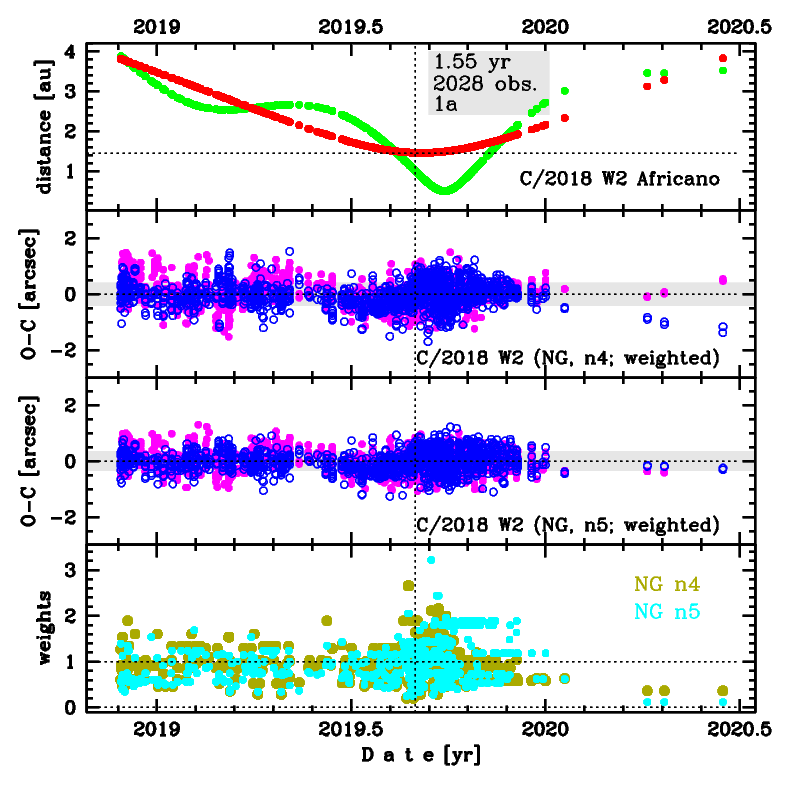
Upper panel: Time distribution of positional observations with corresponding heliocentric (red curve) and geocentric (green curve) distance at which they were taken. The horizontal dotted line shows the perihelion distance for a given comet whereas vertical dotted line — the moment of perihelion passage.
Middle panel(s): O-C diagram for a given solution (sometimes in comparison to another solution available in CODE), where residuals in right ascension are shown using magenta dots and in declination by blue open circles.
Lowest panel: Relative weights for a given data set(s).
Middle panel(s): O-C diagram for a given solution (sometimes in comparison to another solution available in CODE), where residuals in right ascension are shown using magenta dots and in declination by blue open circles.
Lowest panel: Relative weights for a given data set(s).
| next_g orbit statistics, here only the Galactic tide has been included | ||
|---|---|---|
| no. of returning VCs in the swarm | 0 | |
| no. of escaping VCs in the swarm | 5001 | |
| no. of hyperbolas among escaping VCs in the swarm | 5001 | * |
| next reciprocal semi-major axis [10-6 au-1] | -250.17 – -247.61 – -244.92 | |
| next perihelion distance [au] | 0.206 – 0.218 – 0.23 | |
| synchronous stop epoch [Myr] | 1.1 | S |
| percentage of VCs with qnext < 10 | 100 | |