C/2020 F2 ATLAS
more info
Comet C/2020 F2 was discovered on 21 March 2020, more than three years before its perihelion passage. Later a series of pre-discovery observations were found going back to 27 May 2019 (heliocentric disctance: 10.96 au). This comet was observed until 30 May 2024 (as in February 2025).
Comet had its closest approach to the Earth on 19 April 2022 (7.85 au); about three months before its perihelion passage.
The preferred GR solution given here is based on data span over 5.01 yr in a range of heliocentric distances: 10.96 au – 8.82 au (perihelion) – 9.66 au.
This Oort spike comet suffers tiny planetary perturbations during its passage through the planetary system that lead to a bit less tight future orbit inside the Oort spike zone (see future barycentric orbits).
| solution description | ||
|---|---|---|
| number of observations | 748 | |
| data interval | 2022 07 16 – 2024 05 30 | |
| data arc selection | data generally limited to post-perihelion (POS) | |
| range of heliocentric distances | 8.82 au – 9.66au | |
| detectability of NG effects in the comet's motion | NG effects not determinable | |
| type of model of motion | GR - gravitational orbit | |
| data weighting | YES | |
| number of residuals | 1482 | |
| RMS [arcseconds] | 0.37 | |
| orbit quality class | 1a | |
| next orbit statistics, both Galactic and stellar perturbations were taken into account | ||
|---|---|---|
| no. of returning VCs in the swarm | 5001 | * |
| no. of escaping VCs in the swarm | 0 | |
| no. of hyperbolas among escaping VCs in the swarm | 0 | |
| next reciprocal semi-major axis [10-6 au-1] | 24.28 – 25.11 – 25.88 | |
| next perihelion distance [au] | 92 – 100 – 120 | |
| next aphelion distance [103 au] | 77.2 – 79.6 – 82.2 | |
| time interval to next perihelion [Myr] | 7.13 – 7.46 – 7.82 | |
| percentage of VCs with qnext > 20 | 100 | |
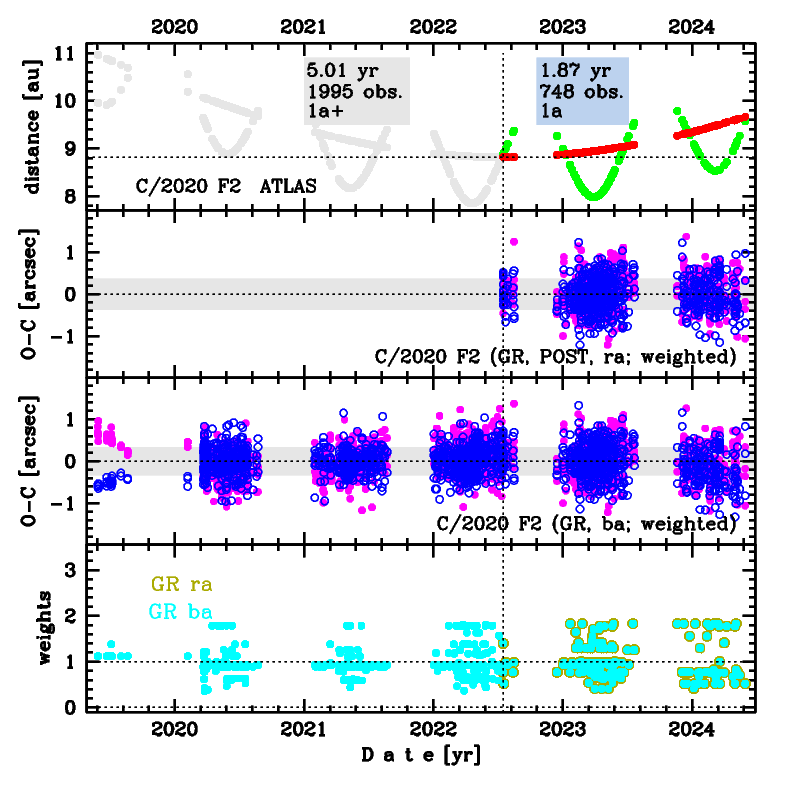
Upper panel: Time distribution of positional observations with corresponding heliocentric (red curve) and geocentric (green curve) distance at which they were taken. The horizontal dotted line shows the perihelion distance for a given comet whereas vertical dotted line — the moment of perihelion passage.
Middle panel(s): O-C diagram for a given solution (sometimes in comparison to another solution available in CODE), where residuals in right ascension are shown using magenta dots and in declination by blue open circles.
Lowest panel: Relative weights for a given data set(s).
Middle panel(s): O-C diagram for a given solution (sometimes in comparison to another solution available in CODE), where residuals in right ascension are shown using magenta dots and in declination by blue open circles.
Lowest panel: Relative weights for a given data set(s).
| next_g orbit statistics, here only the Galactic tide has been included | ||
|---|---|---|
| no. of returning VCs in the swarm | 5001 | * |
| no. of escaping VCs in the swarm | 0 | |
| no. of hyperbolas among escaping VCs in the swarm | 0 | |
| next reciprocal semi-major axis [10-6 au-1] | 25.58 – 26.44 – 27.28 | |
| next perihelion distance [au] | 16 – 22 – 30 | |
| next aphelion distance [103 au] | 73.3 – 75.6 – 78.2 | |
| time interval to next perihelion [Myr] | 6.71 – 7.01 – 7.33 | |
| percentage of VCs with 10 < qnext < 20 | 33 | |
| percentage of VCs with qnext > 20 | 67 | |