C/2020 U4 PanSTARRS
more info
Comet C/2020 U4 was discovered on 22 October 2020, about 1.5 yr before its perihelion passage; later a series of prediscovery images was found going back to 9 November 2019. This comet was observed until 11 September 2024 (as in February 2025).
Comet had its closest approach to the Earth on 30 November 2021 (4.47 au); a bit more than four months before the perihelion passage.
Solution given here is based on data span over 4.84 yr in a range of heliocentric distances: 8.24 au – 5.35 au (perihelion) – 8.26 au. Orbits based on pre-perihelion and post-perihelion data independently were also obtained.
This Oort spike comet suffers small planetary perturbations during its passage through the planetary system; however, they lead to escape the comet from the solar system on hyperbolic barycentric orbit.
| solution description | ||
|---|---|---|
| number of observations | 530 | |
| data interval | 2022 07 24 – 2024 09 11 | |
| data arc selection | data generally limited to post-perihelion (POS) | |
| range of heliocentric distances | 5.41 au – 8.26au | |
| detectability of NG effects in the comet's motion | NG effects not determinable | |
| type of model of motion | GR - gravitational orbit | |
| data weighting | YES | |
| number of residuals | 1051 | |
| RMS [arcseconds] | 0.44 | |
| orbit quality class | 1a | |
| next orbit statistics, both Galactic and stellar perturbations were taken into account | ||
|---|---|---|
| no. of returning VCs in the swarm | 0 | |
| no. of escaping VCs in the swarm | 5001 | |
| no. of hyperbolas among escaping VCs in the swarm | 5001 | * |
| next reciprocal semi-major axis [10-6 au-1] | -114.09 – -112.60 – -111.13 | |
| next perihelion distance [au] | 157.9 – 159.4 – 161 | |
| synchronous stop epoch [Myr] | 1.45 | S |
| percentage of VCs with qnext > 20 | 100 | |
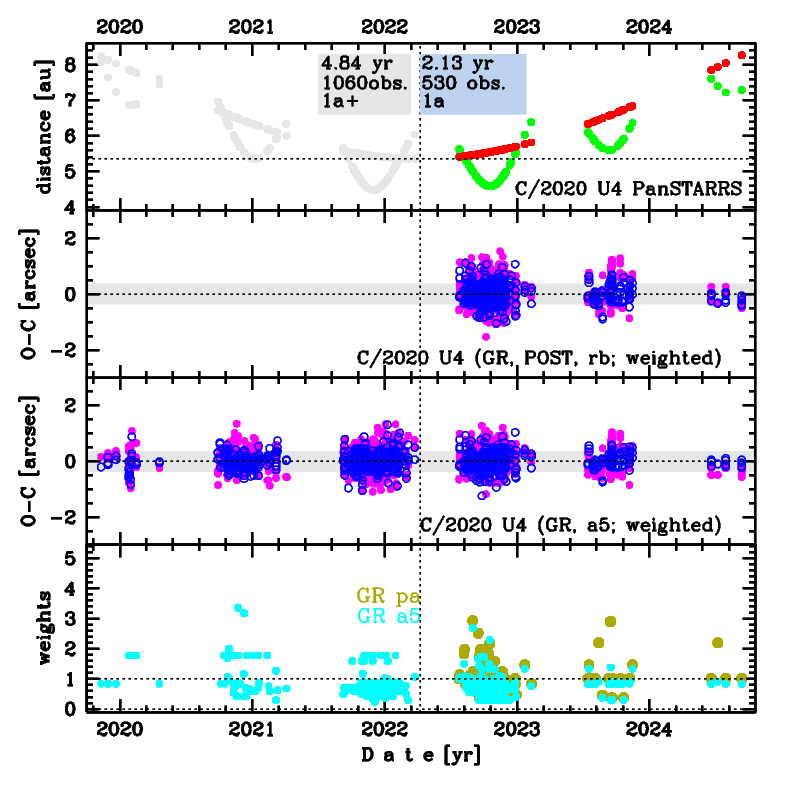
Upper panel: Time distribution of positional observations with corresponding heliocentric (red curve) and geocentric (green curve) distance at which they were taken. The horizontal dotted line shows the perihelion distance for a given comet whereas vertical dotted line — the moment of perihelion passage.
Middle panel(s): O-C diagram for a given solution (sometimes in comparison to another solution available in CODE), where residuals in right ascension are shown using magenta dots and in declination by blue open circles.
Lowest panel: Relative weights for a given data set(s).
Middle panel(s): O-C diagram for a given solution (sometimes in comparison to another solution available in CODE), where residuals in right ascension are shown using magenta dots and in declination by blue open circles.
Lowest panel: Relative weights for a given data set(s).
| next_g orbit statistics, here only the Galactic tide has been included | ||
|---|---|---|
| no. of returning VCs in the swarm | 0 | |
| no. of escaping VCs in the swarm | 5001 | |
| no. of hyperbolas among escaping VCs in the swarm | 5001 | * |
| next reciprocal semi-major axis [10-6 au-1] | -119.35 – -117.83 – -116.34 | |
| next perihelion distance [au] | 1.565 – 1.574 – 1.583 | |
| synchronous stop epoch [Myr] | 1.48 | S |
| percentage of VCs with qnext < 10 | 100 | |