C/2020 W5 Lemmon
more info
Comet C/2020 W5 was discovered on 20 November 2020, about 10 days before its perihelion passage and was observed to 8 January 2021.
Comet had its closest approach to the Earth on 1 December 2020 (2.51 au); a bit after its perihelion passage.
The preferred GR solution given here is based on data span over 0.192 yr in a very narrow range of heliocentric distances: 3.38 au – 3.36 au (perihelion) – 3.38 au. Due to short data arc uncertainties of orbital elements are relatively large (orbit of 2b quality class).
This Oort spike comet suffers moderate planetary perturbations during its passage through the planetary system that lead to escape the comet from the solar system on hyperbolic barycentric orbit.
| solution description | ||
|---|---|---|
| number of observations | 55 | |
| data interval | 2020 11 20 – 2021 01 08 | |
| data arc selection | some part of the available data set (ST2) | |
| range of heliocentric distances | 3.37 au – 3.36 au (perihelion) – 3.38 au | |
| detectability of NG effects in the comet's motion | NG effects not determinable | |
| type of model of motion | GR - gravitational orbit | |
| data weighting | YES | |
| number of residuals | 106 | |
| RMS [arcseconds] | 0.39 | |
| orbit quality class | 2b | |
| orbital elements (heliocentric ecliptic J2000) | ||
|---|---|---|
| Epoch | 2020 12 17 | |
| perihelion date | 2020 11 30.12656045 | ± 0.02497155 |
| perihelion distance [au] | 3.36420865 | ± 0.00013174 |
| eccentricity | 1.00100197 | ± 0.00030683 |
| argument of perihelion [°] | 24.485455 | ± 0.005402 |
| ascending node [°] | 75.512762 | ± 0.001763 |
| inclination [°] | 88.586673 | ± 0.003608 |
| reciprocal semi-major axis [10-6 au-1] | -297.83 | ± 91.19 |
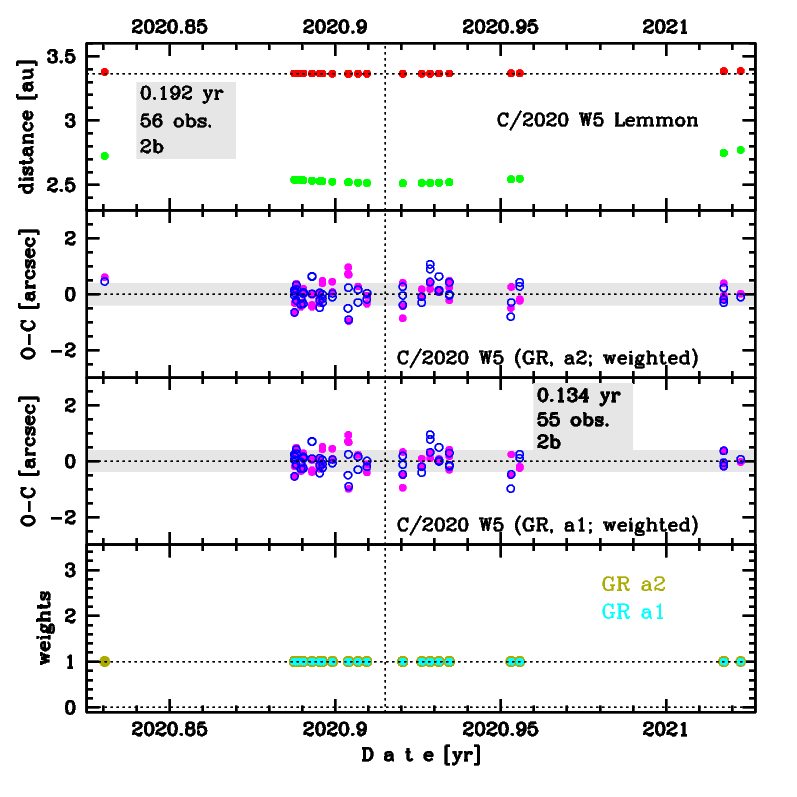
Upper panel: Time distribution of positional observations with corresponding heliocentric (red curve) and geocentric (green curve) distance at which they were taken. The horizontal dotted line shows the perihelion distance for a given comet whereas vertical dotted line — the moment of perihelion passage.
Middle panel(s): O-C diagram for a given solution (sometimes in comparison to another solution available in CODE), where residuals in right ascension are shown using magenta dots and in declination by blue open circles.
Lowest panel: Relative weights for a given data set(s).
Middle panel(s): O-C diagram for a given solution (sometimes in comparison to another solution available in CODE), where residuals in right ascension are shown using magenta dots and in declination by blue open circles.
Lowest panel: Relative weights for a given data set(s).