C/1999 F1 Catalina
more info
Comet C/1999 F1 was discovered on 23 March 1999 by the Catalina Sky Survey, 2.9 yr before perihelion passage. In April, orbit determination by B.G. Marsden showed that the object was a long-period comet moving on a hightly-inclined orbit, and allowed to find the pre-discovery observations in Spacewatch data [IAUC 7148, 1999 April 20].
This comet made its closest approach to the Earth on 13 April 2001 (5.534 au), ten months before perihelion.
Solutions given here are based on data spanning over 6.5 yr in a range of heliocentric distances: 9.28 au – 5.787 au (perihelion) – 10.4 au.
This Oort spike comets suffered almost insignificant planetary perturbations during its passage through the planetary system.
See also Królikowska and Dones 2023, Królikowska and Dybczyński 2017,and Królikowska 2014.
| solution description | ||
|---|---|---|
| number of observations | 56 | |
| data interval | 2002 09 28 – 2005 08 28 | |
| data arc selection | data generally limited to post-perihelion (POS) | |
| range of heliocentric distances | 6.01 au – 10.39au | |
| detectability of NG effects in the comet's motion | NG effects not determinable | |
| type of model of motion | GR - gravitational orbit | |
| data weighting | NO | |
| number of residuals | 111 | |
| RMS [arcseconds] | 0.67 | |
| orbit quality class | 1a | |
| orbital elements (barycentric ecliptic J2000) | ||
|---|---|---|
| Epoch | 2308 11 18 | |
| perihelion date | 2002 02 14.78157794 | ± 0.00567276 |
| perihelion distance [au] | 5.78381413 | ± 0.00004129 |
| eccentricity | 0.99985113 | ± 0.00002201 |
| argument of perihelion [°] | 255.167226 | ± 0.000645 |
| ascending node [°] | 20.001981 | ± 0.000062 |
| inclination [°] | 91.98975 | ± 0.000059 |
| reciprocal semi-major axis [10-6 au-1] | 25.74 | ± 3.80 |
| file containing 5001 VCs swarm |
|---|
| 1999f1r1.bpl |
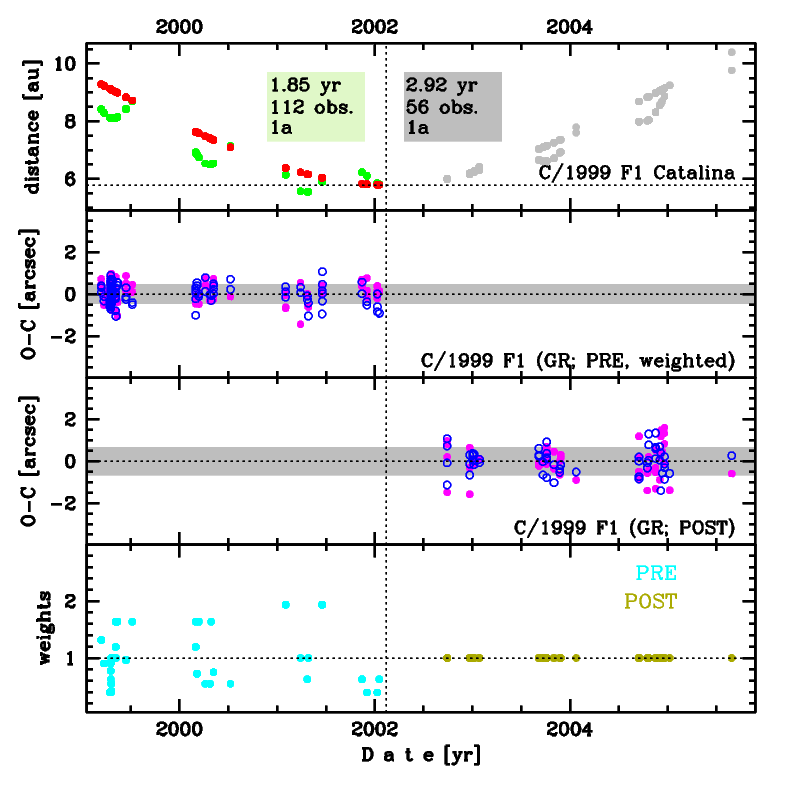
Upper panel: Time distribution of positional observations with corresponding heliocentric (red curve) and geocentric (green curve) distance at which they were taken. The horizontal dotted line shows the perihelion distance for a given comet whereas vertical dotted line — the moment of perihelion passage.
Middle panel(s): O-C diagram for a given solution (sometimes in comparison to another solution available in CODE), where residuals in right ascension are shown using magenta dots and in declination by blue open circles.
Lowest panel: Relative weights for a given data set(s).
Middle panel(s): O-C diagram for a given solution (sometimes in comparison to another solution available in CODE), where residuals in right ascension are shown using magenta dots and in declination by blue open circles.
Lowest panel: Relative weights for a given data set(s).
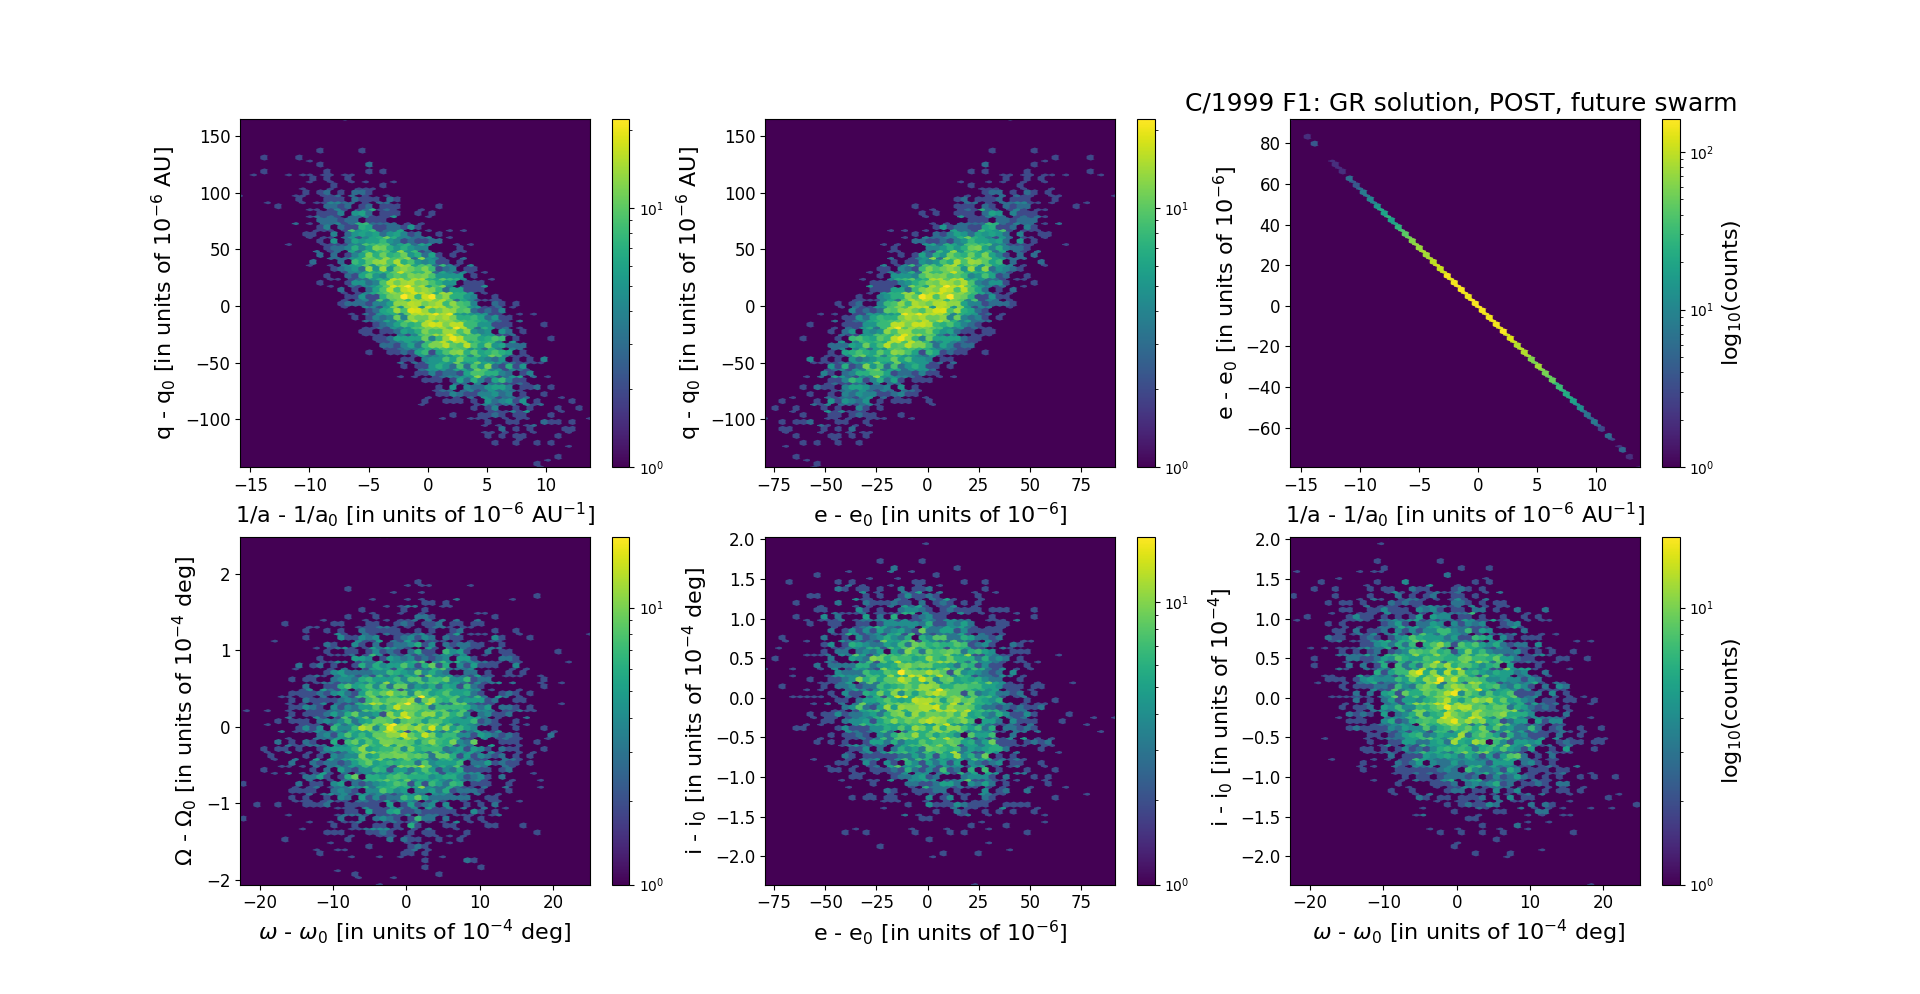
Six 2D-projections of the 6D space of future swarm including 5001 VCs. Each density map is given in logarithmic scale presented on the right in the individual panel.