C/1999 H3 LINEAR
more info
C/1999 H3 was discovered as an apparently asteroidal object by LINEAR on 22 April 1999 (about four months before perihelion passage). Next day was reported as cometary object by observers from Klet and Ondrejov [IAUC 7151, 1999 April 23].
This comet made its closest approach to Earth on 6 March 2000 (3.185 au), about 7.5 months after perihelion.
Solution given here is based on data span over 2.9 yr in a range of heliocentric distances: 3.66 au – 3.501 au (perihelion) – 8.48 au.
NG orbits using full data-arc as well as using post-perihelion data are determinable.
See also Królikowska and Dones 2023, Królikowska and Dybczyński 2017,and Królikowska 2014.
| solution description | ||
|---|---|---|
| number of observations | 317 | |
| data interval | 1999 04 22 – 1999 08 13 | |
| data arc selection | data generally limited to pre-perihelion (PRE) | |
| range of heliocentric distances | 3.66 au – 3.5au | |
| detectability of NG effects in the comet's motion | comet with NG effects strongly manifested in positional data fitting | |
| type of model of motion | GR - gravitational orbit | |
| data weighting | YES | |
| number of residuals | 619 | |
| RMS [arcseconds] | 0.49 | |
| orbit quality class | 2a | |
| orbital elements (heliocentric ecliptic J2000) | ||
|---|---|---|
| Epoch | 1999 08 10 | |
| perihelion date | 1999 08 18.23880083 | ± 0.00298092 |
| perihelion distance [au] | 3.50086879 | ± 0.00001297 |
| eccentricity | 1.00280352 | ± 0.00003319 |
| argument of perihelion [°] | 101.912432 | ± 0.000592 |
| ascending node [°] | 332.724161 | ± 0.000083 |
| inclination [°] | 115.840184 | ± 0.000036 |
| reciprocal semi-major axis [10-6 au-1] | -800.81 | ± 9.48 |
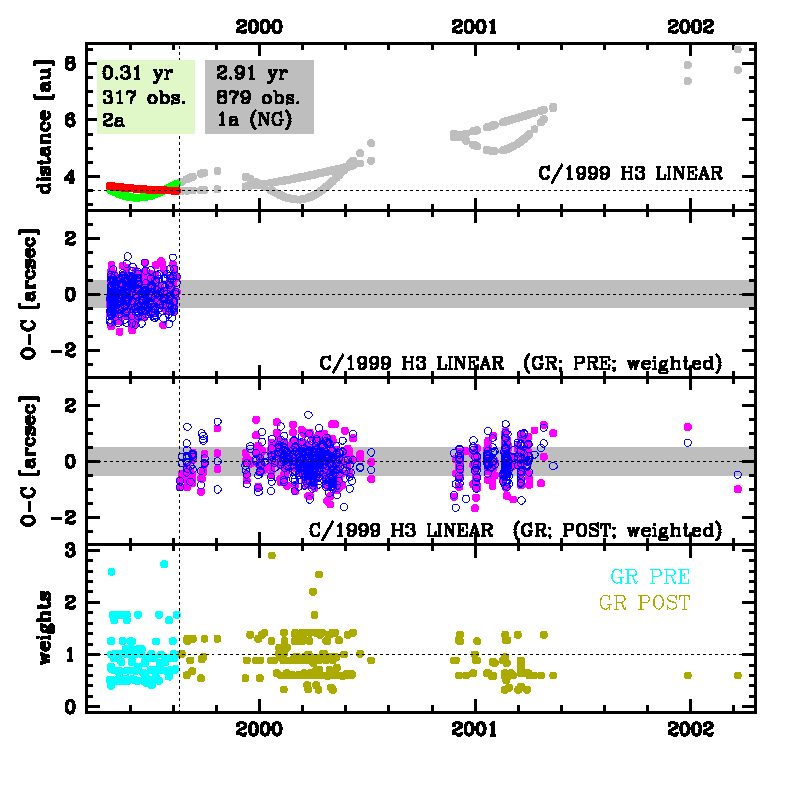
Upper panel: Time distribution of positional observations with corresponding heliocentric (red curve) and geocentric (green curve) distance at which they were taken. The horizontal dotted line shows the perihelion distance for a given comet whereas vertical dotted line — the moment of perihelion passage.
Middle panel(s): O-C diagram for a given solution (sometimes in comparison to another solution available in CODE), where residuals in right ascension are shown using magenta dots and in declination by blue open circles.
Lowest panel: Relative weights for a given data set(s).
Middle panel(s): O-C diagram for a given solution (sometimes in comparison to another solution available in CODE), where residuals in right ascension are shown using magenta dots and in declination by blue open circles.
Lowest panel: Relative weights for a given data set(s).