C/2010 U3 Boattini
more info
Comet C/2010 U3 was discovered on 31 October 2010. Several prediscovery images of this comet were found: taken at Mauna Kea on 18 and 30 October 2006 and 5 November 2005. At the moment of discovery, it was more than 8 years before its perihelion passage (see figure). In August 2023, data arc extends up to 15 April 2023 and are available at MPC.
Solutions given here are based on data covered 26.1 yr in a range of heliocentric distances: 26.1 au – 5.131 au (perihelion) – 19.8 au.
Comet had its closest approach to the Earth on 27 January 2019 (7.929 au, one months before perihelion).
Solutions given here are based on a set of data spanning over by 15.36 yr in a range of heliocentric distances: 25.75 au au – 8.446 au (perihelion) – 9.52 au (June 2023).
Some signs of NG acceleration in the motion of this comet are seen.
This Oort spike comet suffers a small planetary perturbations during its passage through the planetary system.
See also Królikowska and Dones 2023.
| solution description | ||
|---|---|---|
| number of observations | 599 | |
| data interval | 2019 02 27 – 2021 03 18 | |
| data arc selection | data generally limited to post-perihelion (POS) | |
| range of heliocentric distances | 8.48 au – 9.52au | |
| detectability of NG effects in the comet's motion | comet with determinable NG~orbit | |
| type of model of motion | GR - gravitational orbit | |
| data weighting | YES | |
| number of residuals | 1179 | |
| RMS [arcseconds] | 0.55 | |
| orbit quality class | 1a | |
| next orbit statistics, both Galactic and stellar perturbations were taken into account | ||
|---|---|---|
| no. of returning VCs in the swarm | 5001 | * |
| no. of escaping VCs in the swarm | 0 | |
| no. of hyperbolas among escaping VCs in the swarm | 0 | |
| next reciprocal semi-major axis [10-6 au-1] | 196.99 – 198.34 – 199.67 | |
| next perihelion distance [au] | 8.4207 – 8.4218 – 8.4227 | |
| next aphelion distance [103 au] | 10.01 – 10.08 – 10.14 | |
| time interval to next perihelion [Myr] | 0.3539 – 0.3574 – 0.3612 | |
| percentage of VCs with qnext < 10 | 100 | |
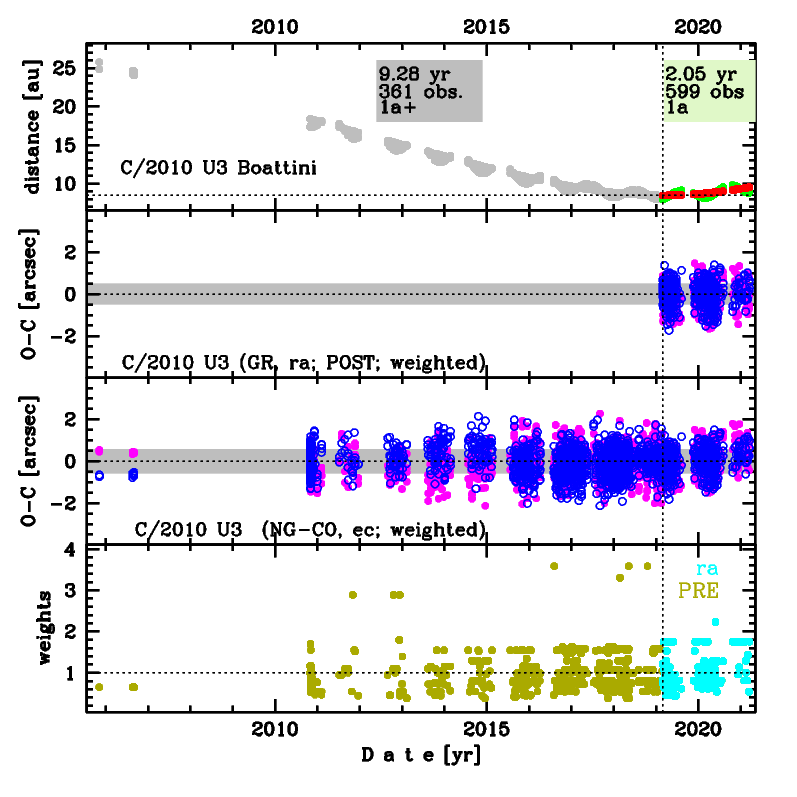
Upper panel: Time distribution of positional observations with corresponding heliocentric (red curve) and geocentric (green curve) distance at which they were taken. The horizontal dotted line shows the perihelion distance for a given comet whereas vertical dotted line — the moment of perihelion passage.
Middle panel(s): O-C diagram for a given solution (sometimes in comparison to another solution available in CODE), where residuals in right ascension are shown using magenta dots and in declination by blue open circles.
Lowest panel: Relative weights for a given data set(s).
Middle panel(s): O-C diagram for a given solution (sometimes in comparison to another solution available in CODE), where residuals in right ascension are shown using magenta dots and in declination by blue open circles.
Lowest panel: Relative weights for a given data set(s).
| next orbit statistics, here only the Galactic tide has been included | ||
|---|---|---|
| no. of returning VCs in the swarm | 5001 | * |
| no. of escaping VCs in the swarm | 0 | |
| no. of hyperbolas among escaping VCs in the swarm | 0 | |
| next reciprocal semi-major axis [10-6 au-1] | 196.97 – 198.32 – 199.65 | |
| next perihelion distance [au] | 8.4046 – 8.4056 – 8.4066 | |
| next aphelion distance [103 au] | 10.01 – 10.08 – 10.15 | |
| time interval to next perihelion [Myr] | 0.3539 – 0.3575 – 0.3612 | |
| percentage of VCs with qnext < 10 | 100 | |