C/2013 V4 Catalina
more info
Comet C/2013 V4 was discovered on 9 November 2013 with Catalina Sky Survey, that is less than one year before its perihelion passage. Next, it was found on earlier images taken on 23 October 2013 with the Pan-STARRS 1, Haleakala, and 31 October 2013 with Catalina Sky Survey. This comet was observed until 6 August 2018.
Comet had its closest approach to the Earth on 1 December 2015 (4.535 au), less than 2 months after its perihelion passage.
Solutions given here is based on data spanning over 4.79 yr in a range of heliocentric distances: 7.35 au – 5.185 au (perihelion) – 8.99 au.
NG orbit using full data-arc is determinable.
This Oort spike comet suffers slight planetary perturbations during its passage through the planetary system; these perturbations lead to a more tight future orbit (see future barycentric orbits).
See also Królikowska and Dones 2023.
| solution description | ||
|---|---|---|
| number of observations | 2454 | |
| data interval | 2013 10 23 – 2018 08 06 | |
| data type | perihelion within the observation arc (FULL) | |
| data arc selection | entire data set (STD) | |
| range of heliocentric distances | 7.35 au – 5.18 au (perihelion) – 8.99 au | |
| detectability of NG effects in the comet's motion | comet with determinable NG~orbit | |
| type of model of motion | GR - gravitational orbit | |
| data weighting | YES | |
| number of residuals | 4865 | |
| RMS [arcseconds] | 0.48 | |
| orbit quality class | 1a+ | |
| orbital elements (heliocentric ecliptic J2000) | ||
|---|---|---|
| Epoch | 2015 10 25 | |
| perihelion date | 2015 10 07.60099336 | ± 0.00014790 |
| perihelion distance [au] | 5.18541111 | ± 0.00000080 |
| eccentricity | 1.00257939 | ± 0.00000122 |
| argument of perihelion [°] | 40.449295 | ± 0.000015 |
| ascending node [°] | 55.621304 | ± 0.000003 |
| inclination [°] | 67.855376 | ± 0.000005 |
| reciprocal semi-major axis [10-6 au-1] | -497.43 | ± 0.23 |
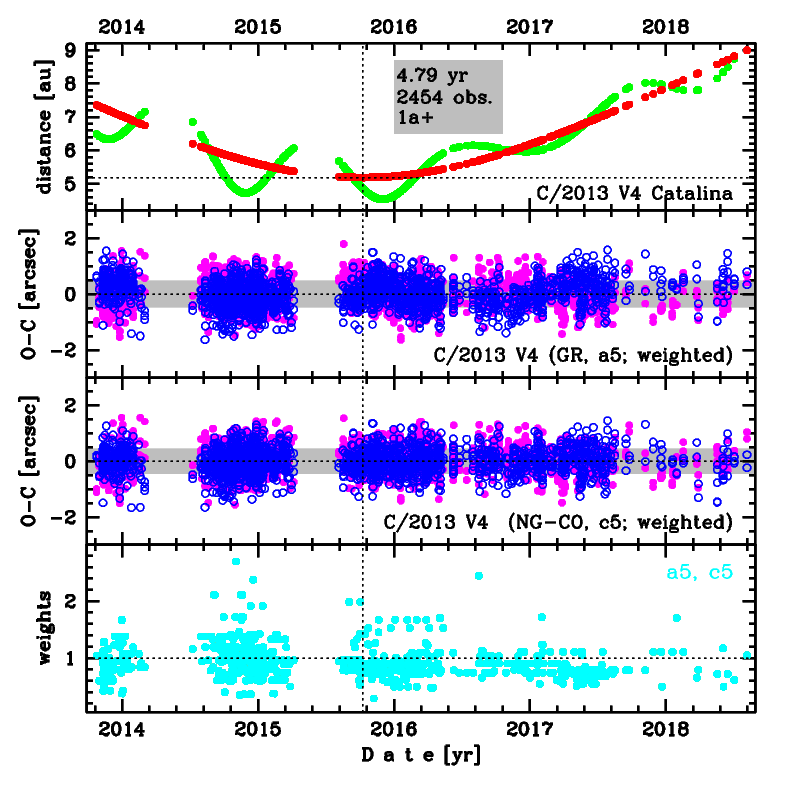
Upper panel: Time distribution of positional observations with corresponding heliocentric (red curve) and geocentric (green curve) distance at which they were taken. The horizontal dotted line shows the perihelion distance for a given comet whereas vertical dotted line — the moment of perihelion passage.
Middle panel(s): O-C diagram for a given solution (sometimes in comparison to another solution available in CODE), where residuals in right ascension are shown using magenta dots and in declination by blue open circles.
Lowest panel: Relative weights for a given data set(s).
Middle panel(s): O-C diagram for a given solution (sometimes in comparison to another solution available in CODE), where residuals in right ascension are shown using magenta dots and in declination by blue open circles.
Lowest panel: Relative weights for a given data set(s).