C/2016 N4 Master
more info
Comet C/2016 N4 was discovered on 15 July 2016 with Mobile Astronomical System of the Telescope-Robots (MASTER), that is about months after its perihelion passage.
Some prediscovery images of this comet were found: taken on 11 September 2015 by ISON-SSO Observatory (Siding Spring).
Solutions given here are based on data spanning over 4.54 yr in a range of heliocentric distances: 7.14 au – 3.199 au (perihelion) – 8.37 au.
NG orbits using full data-arc as well as independently using pre-perihelion and post-perihelion data are determinable.
See also Królikowska and Dones 2023.
| solution description | ||
|---|---|---|
| number of observations | 1045 | |
| data interval | 2017 09 16 – 2020 03 26 | |
| data arc selection | data generally limited to post-perihelion (POS) | |
| range of heliocentric distances | 3.2 au – 3.20 au (perihelion) – 8.37 au | |
| detectability of NG effects in the comet's motion | comet with determinable NG~orbit | |
| type of model of motion | GR - gravitational orbit | |
| data weighting | YES | |
| number of residuals | 2065 | |
| RMS [arcseconds] | 0.44 | |
| orbit quality class | 1a+ | |
| next orbit statistics, both Galactic and stellar perturbations were taken into account | ||
|---|---|---|
| no. of returning VCs in the swarm | 5001 | * |
| no. of escaping VCs in the swarm | 0 | |
| no. of hyperbolas among escaping VCs in the swarm | 0 | |
| next reciprocal semi-major axis [10-6 au-1] | 228.37 – 229.02 – 229.66 | |
| next perihelion distance [au] | 3.19636 – 3.19639 – 3.19642 | |
| next aphelion distance [103 au] | 8.705 – 8.73 – 8.754 | |
| time interval to next perihelion [Myr] | 0.2868 – 0.2881 – 0.2893 | |
| percentage of VCs with qnext < 10 | 100 | |
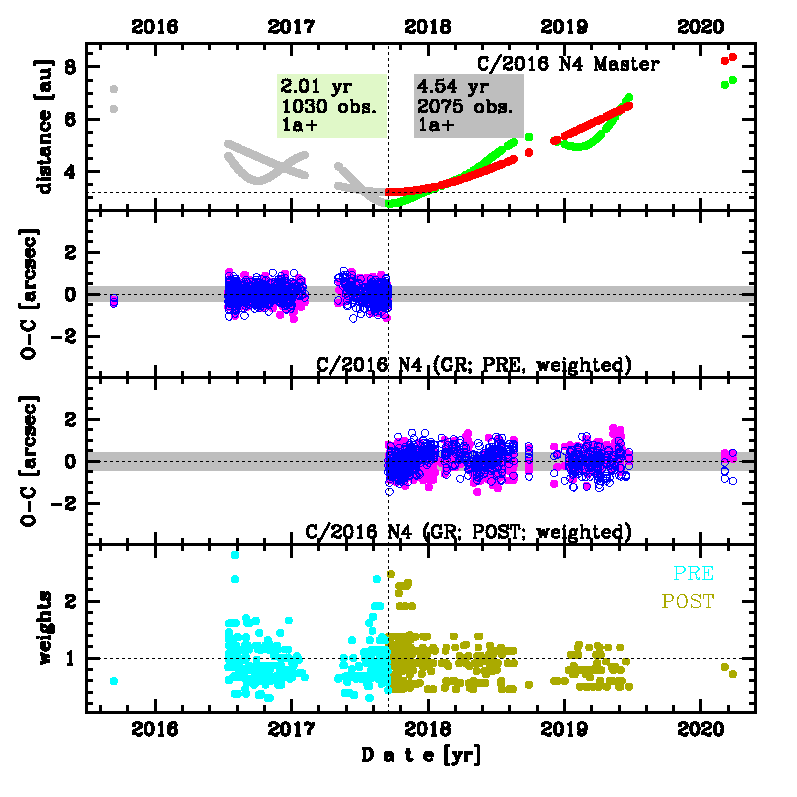
Upper panel: Time distribution of positional observations with corresponding heliocentric (red curve) and geocentric (green curve) distance at which they were taken. The horizontal dotted line shows the perihelion distance for a given comet whereas vertical dotted line — the moment of perihelion passage.
Middle panel(s): O-C diagram for a given solution (sometimes in comparison to another solution available in CODE), where residuals in right ascension are shown using magenta dots and in declination by blue open circles.
Lowest panel: Relative weights for a given data set(s).
Middle panel(s): O-C diagram for a given solution (sometimes in comparison to another solution available in CODE), where residuals in right ascension are shown using magenta dots and in declination by blue open circles.
Lowest panel: Relative weights for a given data set(s).
| next orbit statistics, here only the Galactic tide has been included | ||
|---|---|---|
| no. of returning VCs in the swarm | 5001 | * |
| no. of escaping VCs in the swarm | 0 | |
| no. of hyperbolas among escaping VCs in the swarm | 0 | |
| next reciprocal semi-major axis [10-6 au-1] | 228.38 – 229.02 – 229.67 | |
| next perihelion distance [au] | 3.20522 – 3.20526 – 3.2053 | |
| next aphelion distance [103 au] | 8.705 – 8.729 – 8.754 | |
| time interval to next perihelion [Myr] | 0.2868 – 0.288 – 0.2893 | |
| percentage of VCs with qnext < 10 | 100 | |