C/1886 T1 Barnard-Hartwig
more info
C/1886 T1 was discovered on 5 October 1886 by Edward Emerson Barnard (Vanderbilt University Observatory, Nashville, Tennessee, USA). Independently, it was discovered on 6 October byErnst Hartwig (Bamberg Observatory, Germany). At the moment of discovery, the comet was about 2.5 months before its perihelion passage and was last seen on 17 June 1887 [Kronk, Cometography: Volume 2].
This comet made its closest approach to the Earth on 5 December 1886 (0.965 au), that is over 3 weeks after perihelion passage.
Solutions given here are based on data spanning over 0.693 yr in a range of heliocentric distances from 1.50 au through perihelion (0.663 au) to 3.01 au.
This Oort spike comet suffers tiny planetary perturbations during its passage through the planetary system; these perturbations lead to a little bit larger future semimajor axis (see future barycentric orbits).
C/1886 T1 was in the original sample of 19 comets used by Oort for his hypothesis on LPCs; however, according to presented here statistics for previous perihelion passage, dynamical status of this comet is uncertain.
See also Królikowska 2020.
| solution description | ||
|---|---|---|
| number of observations | 320 | |
| data interval | 1886 10 07 – 1887 06 17 | |
| data type | perihelion within the observation arc (FULL) | |
| data arc selection | entire data set (STD) | |
| range of heliocentric distances | 1.5 au – 0.66 au (perihelion) – 3.01 au | |
| detectability of NG effects in the comet's motion | NG effects not determinable | |
| type of model of motion | GR - gravitational orbit | |
| data weighting | YES | |
| number of residuals | 546 | |
| RMS [arcseconds] | 3.80 | |
| orbit quality class | 2a | |
| orbital elements (barycentric ecliptic J2000) | ||
|---|---|---|
| Epoch | 2184 09 08 | |
| perihelion date | 1886 12 17.20493593 | ± 0.00141791 |
| perihelion distance [au] | 0.66485367 | ± 0.00000154 |
| eccentricity | 0.99998988 | ± 0.00001356 |
| argument of perihelion [°] | 86.369486 | ± 0.000275 |
| ascending node [°] | 139.070046 | ± 0.000216 |
| inclination [°] | 101.647046 | ± 0.000274 |
| reciprocal semi-major axis [10-6 au-1] | 15.22 | ± 20.40 |
| file containing 5001 VCs swarm |
|---|
| 1886t1a5.bpl |
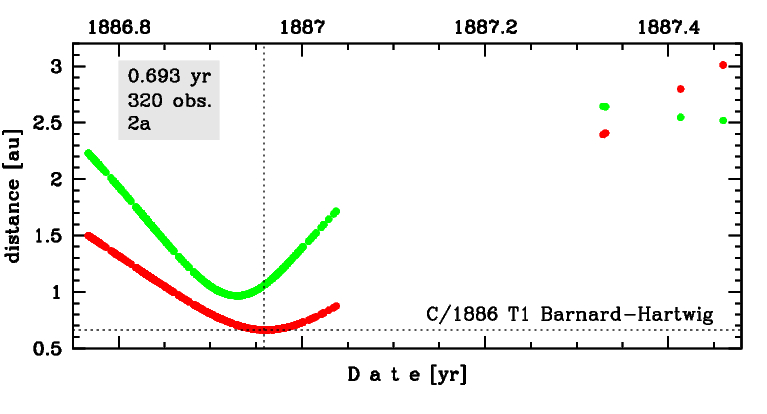
Time distribution of positional observations with corresponding heliocentric (red curve) and geocentric (green curve) distance at which they were taken. The horizontal dotted line shows the perihelion distance for a given comet whereas vertical dotted line — the moment of perihelion passage.
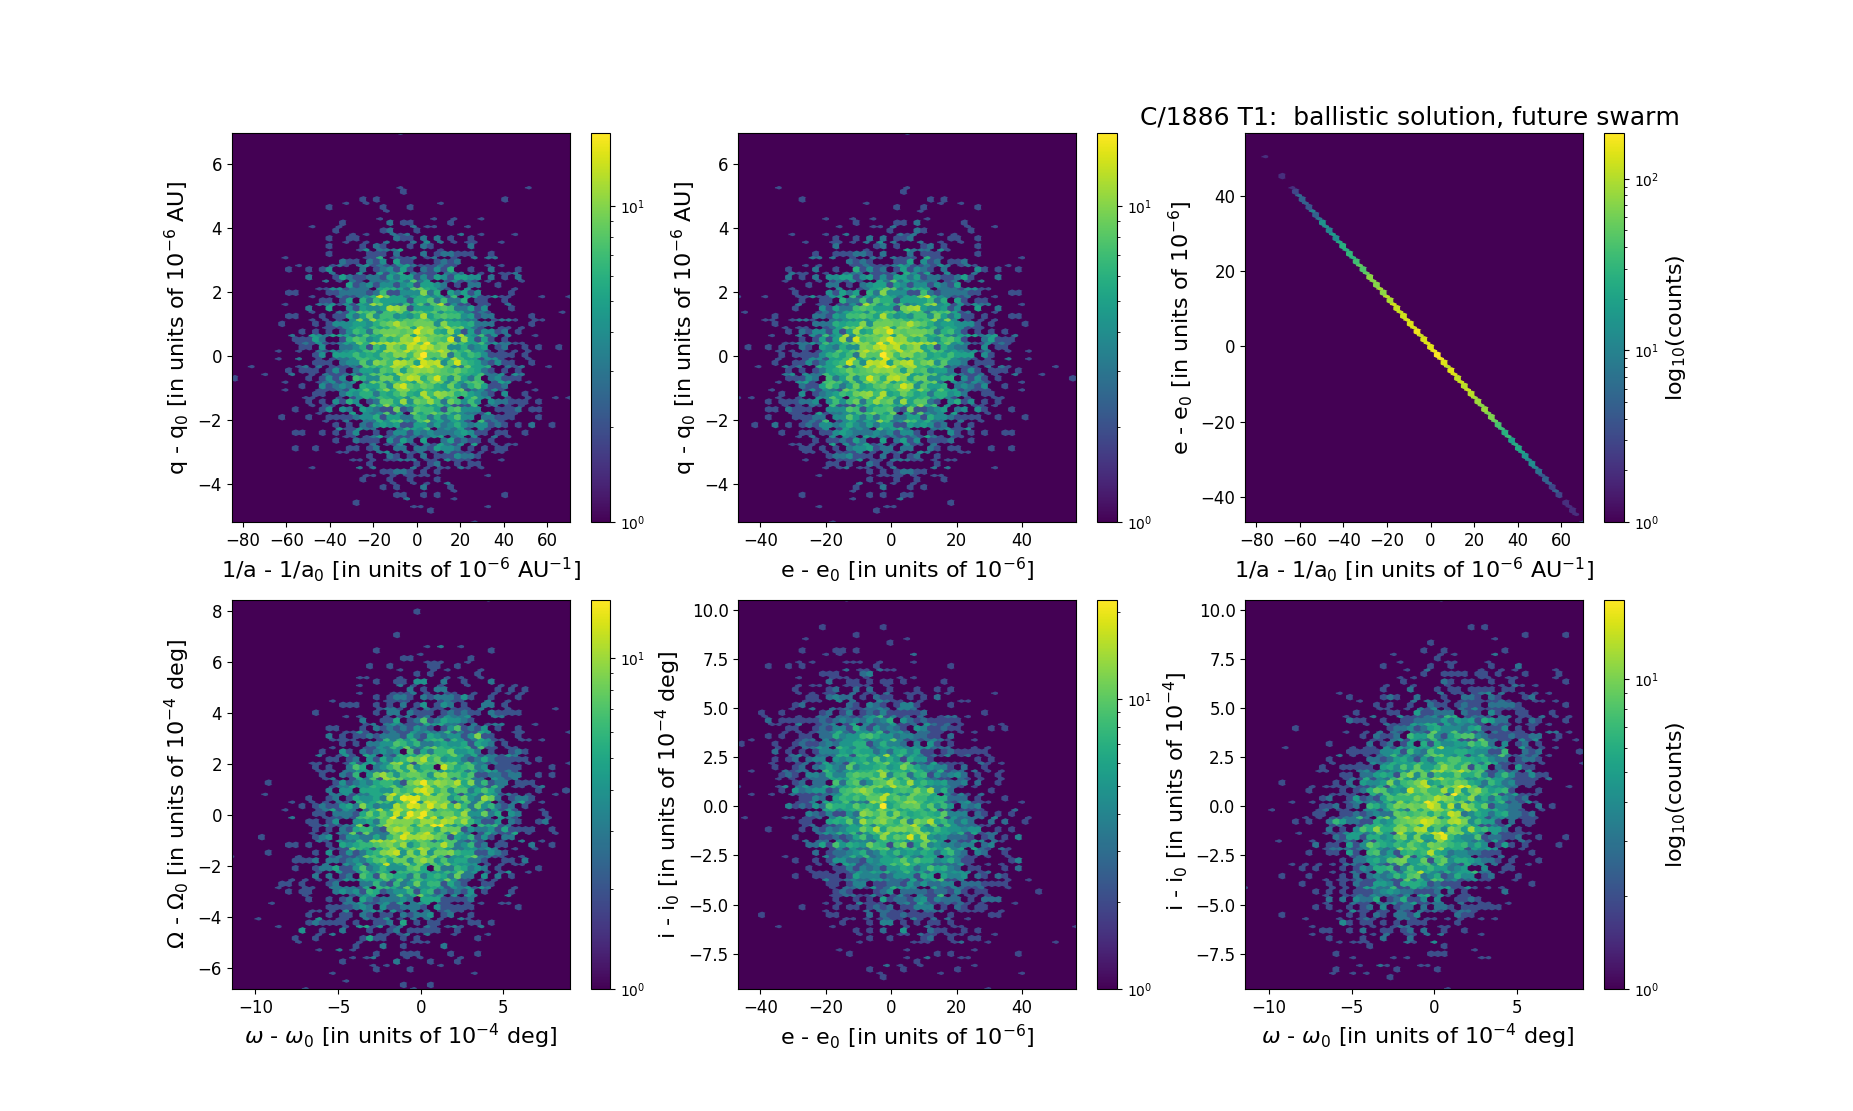
Six 2D-projections of the 6D space of future swarm including 5001 VCs. Each density map is given in logarithmic scale presented on the right in the individual panel.