C/1902 R1 Perrine
more info
Comet C/1902 R1 was discovered on 1 September 1902 by Charles Dillon Perrine (Lick Observatory, California, USA), that is about three months before perihelion passage, and it was last seen on 28 April 1903 [Kronk, Cometography: Volume 3], however the last good quality measurements of its position was made on 31 March.
This comet made its closest approach to the Earth on 7 October 1902 (0.371 au), that is about five weeks after its discovery. At this time it was naked eye object.
Solution given here is based on data spanning over 0.578 yr in a range of heliocentric distances from 1.79 au through perihelion (0.401 au) to 2.44 au.
This Oort spike comet suffers moderate planetary perturbations during its passage through the planetary system that cause a more tight future orbit with semimajor axis of about 1150 au.
This comet was in the original sample of 19 comets used by Oort for his hypothesis on LPCs, and according to presented here statistics for previous perihelion passage, this comet most is dynamically new.
More details in Królikowska et al. 2014.
| solution description | ||
|---|---|---|
| number of observations | 1491 | |
| data interval | 1902 09 01 – 1903 03 31 | |
| data type | perihelion within the observation arc (FULL) | |
| data arc selection | entire data set (STD) | |
| range of heliocentric distances | 1.79 au – 0.40 au (perihelion) – 2.44 au | |
| detectability of NG effects in the comet's motion | NG effects not determinable | |
| type of model of motion | GR - gravitational orbit | |
| data weighting | YES | |
| number of residuals | 2501 | |
| RMS [arcseconds] | 2.28 | |
| orbit quality class | 1b | |
| next orbit statistics, both Galactic and stellar perturbations were taken into account | ||
|---|---|---|
| no. of returning VCs in the swarm | 5001 | * |
| no. of escaping VCs in the swarm | 0 | |
| no. of hyperbolas among escaping VCs in the swarm | 0 | |
| next reciprocal semi-major axis [10-6 au-1] | 868.76 – 870.94 – 873.16 | |
| next perihelion distance [au] | 0.402043 – 0.402045 – 0.402047 | |
| next aphelion distance [103 au] | 2.29 – 2.296 – 2.302 | |
| time interval to next perihelion [Myr] | 0.03833 – 0.03847 – 0.03861 | |
| percentage of VCs with qnext < 10 | 100 | |
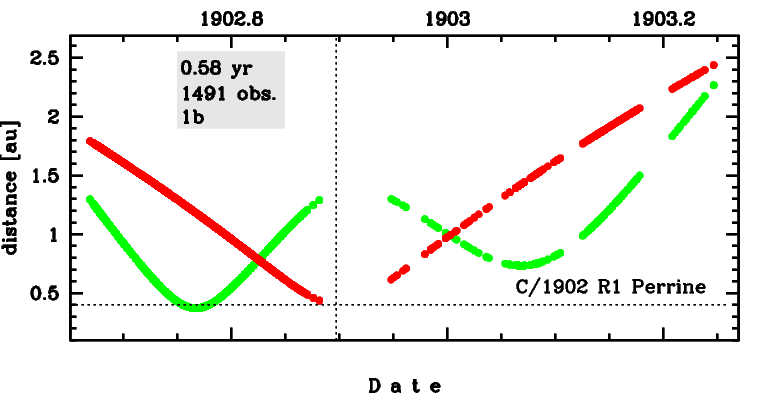
Time distribution of positional observations with corresponding heliocentric (red curve) and geocentric (green curve) distance at which they were taken. The horizontal dotted line shows the perihelion distance for a given comet whereas vertical dotted line — the moment of perihelion passage.
| next_g orbit statistics, here only the Galactic tide has been included | ||
|---|---|---|
| no. of returning VCs in the swarm | 5001 | * |
| no. of escaping VCs in the swarm | 0 | |
| no. of hyperbolas among escaping VCs in the swarm | 0 | |
| next reciprocal semi-major axis [10-6 au-1] | 868.76 – 870.95 – 873.17 | |
| next perihelion distance [au] | 0.401821 – 0.401822 – 0.401822 | |
| next aphelion distance [103 au] | 2.29 – 2.296 – 2.302 | |
| time interval to next perihelion [Myr] | 0.03833 – 0.03847 – 0.03862 | |
| percentage of VCs with qnext < 10 | 100 | |