C/1904 Y1 Giacobini
more info
Comet C/1904 Y1 was discovered on 18 December 1904 by Michel Giacobini (Nice Observatory, France), that is one and a half of month after perihelion passage, and it was last seen on 1 June 1905 [Kronk, Cometography: Volume 3].
This comet made its closest approach to the Earth on 31 May 1904 (1.94 au), that is more than 6.5 months before its discovery. During the observed period it was closest to the Earth on 19 January (2.21 au) that is one month after discovery.
Solution given here is based on data spanning over 0.370 yr in a narrow range of heliocentric distances from 1.96 au through perihelion (1.88 au) to 2.86 au.
This marginally Oort spike comet suffers small planetary perturbations during its passage through the planetary system that lead to more tight future orbit (see future barycentric orbit).
More details in Królikowska et al. 2014.
| solution description | ||
|---|---|---|
| number of observations | 164 | |
| data interval | 1904 12 18 – 1905 05 02 | |
| data type | observed only after perihelion (POST) | |
| data arc selection | entire data set (STD) | |
| range of heliocentric distances | 1.96 au – 2.86au | |
| detectability of NG effects in the comet's motion | NG effects not determinable | |
| type of model of motion | GR - gravitational orbit | |
| data weighting | YES | |
| number of residuals | 164 | |
| RMS [arcseconds] | 2.87 | |
| orbit quality class | 2b | |
| next orbit statistics, both Galactic and stellar perturbations were taken into account | ||
|---|---|---|
| no. of returning VCs in the swarm | 4991 | * |
| no. of escaping VCs in the swarm | 10 | |
| no. of hyperbolas among escaping VCs in the swarm | 6 | |
| next reciprocal semi-major axis [10-6 au-1] | 199.97 – 350.91 – 499.98 | R |
| next perihelion distance [au] | 1.88042 – 1.88235 – 1.88245 | R |
| next aphelion distance [103 au] | 4 – 5.7 – 10 | R |
| time interval to next perihelion [Myr] | 0.089 – 0.15 – 0.35 | R |
| percentage of VCs with qnext < 10 | 100 | |
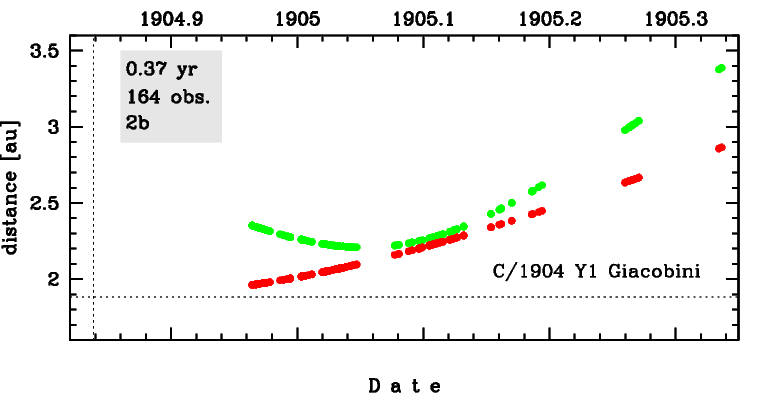
Time distribution of positional observations with corresponding heliocentric (red curve) and geocentric (green curve) distance at which they were taken. The horizontal dotted line shows the perihelion distance for a given comet whereas vertical dotted line — the moment of perihelion passage.
| next_g orbit statistics, here only the Galactic tide has been included | ||
|---|---|---|
| no. of returning VCs in the swarm | 4992 | * |
| no. of escaping VCs in the swarm | 9 | |
| no. of hyperbolas among escaping VCs in the swarm | 6 | |
| next reciprocal semi-major axis [10-6 au-1] | 199.65 – 350.92 – 499.98 | R |
| next perihelion distance [au] | 1.88043 – 1.88264 – 1.8828 | R |
| next aphelion distance [103 au] | 4 – 5.7 – 10 | R |
| time interval to next perihelion [Myr] | 0.089 – 0.15 – 0.35 | R |
| percentage of VCs with qnext < 10 | 100 | |